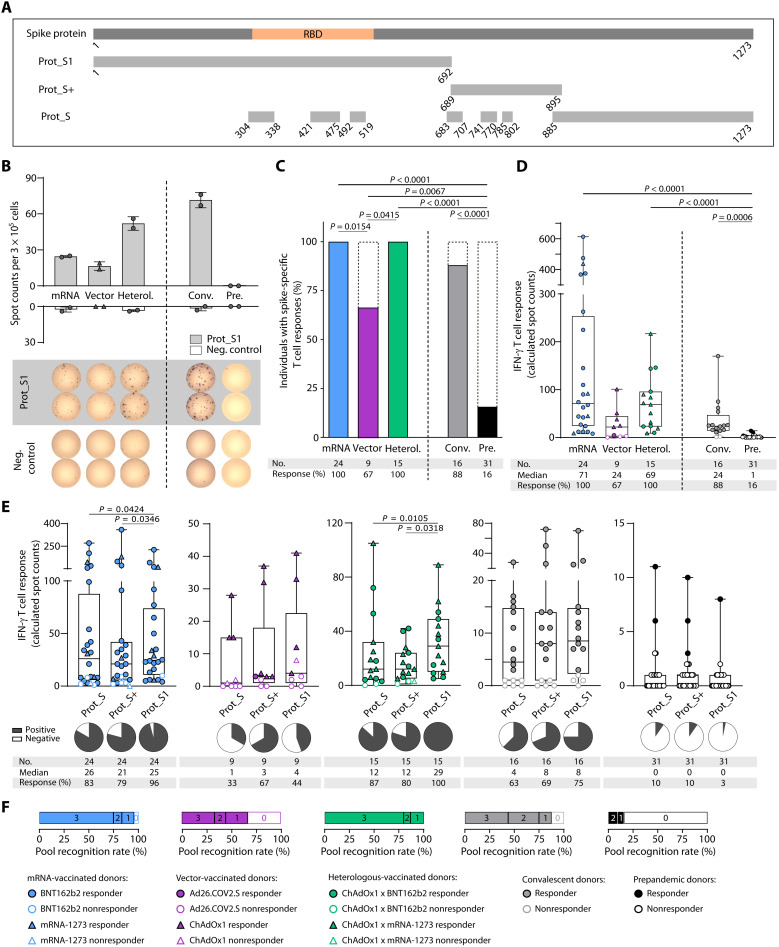
Fig. 1. Ex vivo immune responses to SARS-CoV-2 spike protein peptide pools after complete vaccination.
(A) Schematic depiction of the SARS-CoV-2 spike protein and protein section coverage by the peptide pools (Prot_S1, Prot_S+, and Prot_S) used for immunogenicity testing. (B to F) Ex vivo T cell responses after complete vaccination [two doses of BNT162b2, mRNA-1273, or ChAdOx1; one dose of Ad26.COV2.S; or one dose of the vector vaccine ChAdOx1 followed by one dose of an mRNA vaccine for heterologous (Heterol.) vaccine regimens] compared with COVID-19 convalescents (Conv.) and prepandemic (Pre.) donors were assessed by IFN-γ ELISpot assays 3 to 12 weeks (median, 4 weeks) after the last vaccine dose (sample collection after complete vaccination; Table 1). (B) Representative example of ex vivo IFN-γ T cell responses to the Prot_S1 peptide pool compared with a negative (neg.) control peptide showing duplicates for one donor of each cohort. (C and D) Percentage of individuals with ex vivo IFN-γ ELISpot T cell responses (C) and intensities of IFN-γ T cell responses in terms of calculated spot counts against the spike-specific peptide pools (D) after mRNA, vector, or heterologous vaccination compared with convalescents and prepandemic donors (summarized responses against the three spike-specific peptide pools). (E) Intensities of ex vivo IFN-γ T cell responses shown for the distinct spike protein peptide pools. (F) Proportion of individuals (cohorts as indicated by color code) with responses to all three, two, one, or none of the spike peptide pools. Responders are represented by colored symbols, and nonresponders are represented by clear symbols. Symbol shapes indicate the different vaccine products received by the donors. (D and E) Box plots represent the median with the 25th and 75th percentiles with minimum and maximum whiskers. (C) Fisher’s exact test was used. (D) Kruskal-Wallis test was used. (E) Friedman test was used. If P values are not shown, then results were not significant. RBD, receptor binding domain; No., number.

