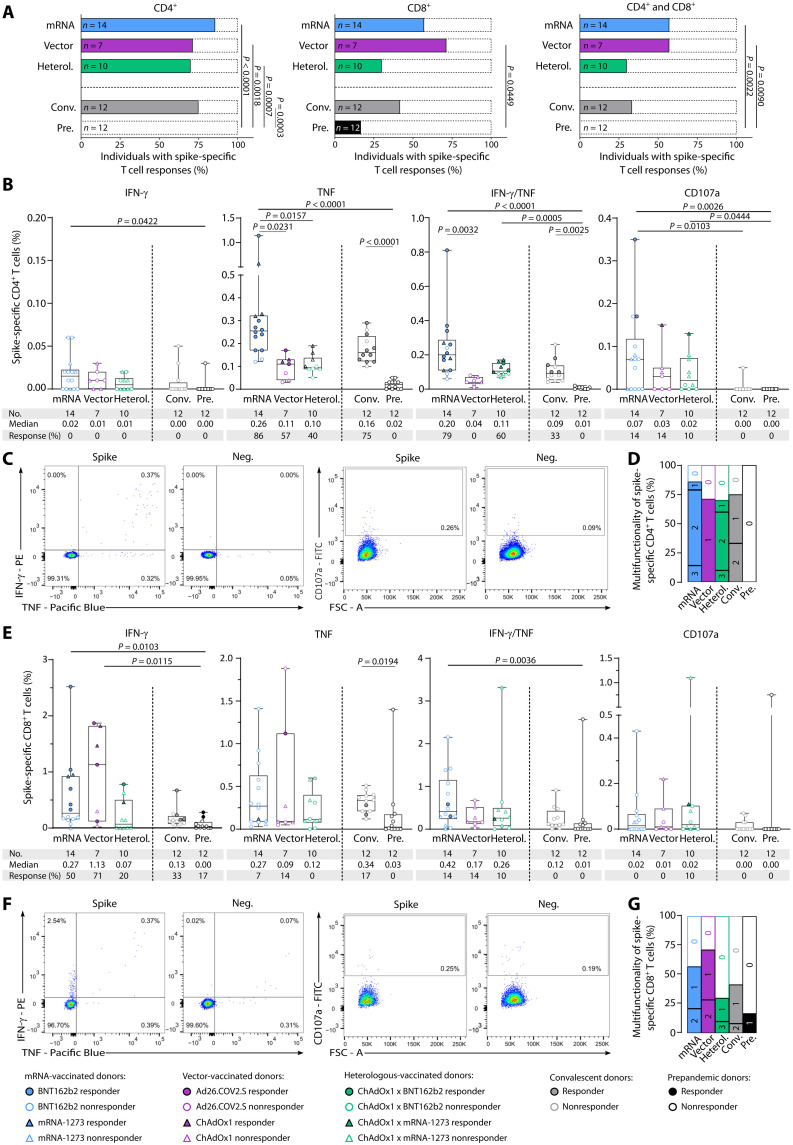
Fig. 3. Ex vivo characterization of spike-specific T cell responses after complete vaccination.
Spike-specific T cell responses after complete vaccination (two doses of BNT162b2, mRNA-1273, or ChAdOx1; one dose of Ad26.COV2.S; or one dose of the vector vaccine ChAdOx1 followed by one dose of an mRNA vaccine for heterologous (Heterol. vaccine regimens) were characterized ex vivo by intracellular cytokine (IFN-γ and TNF) and surface marker (CD107a) staining. (A) Percentage of individuals with ex vivo CD4+ (left), CD8+ (middle), and both CD4+ and CD8+ (right) T cell responses to the SARS-CoV-2 spike–specific peptide pools. (B) Frequencies of spike-specific CD4+ T cells after complete vaccination assessed ex vivo. (C) Exemplary flow cytometry data of indicated cytokines and surface marker shown for CD4+ T cells for one donor after complete vaccination (BNT162b2 x BNT162b2) with an mRNA vaccine. (D) Proportion of samples with nonfunctional (0), monofunctional (1), bifunctional (2), or trifunctional (3) spike-specific CD4+ T cells after complete vaccination. (E) Frequencies of spike-specific CD8+ T cells after complete vaccination assessed ex vivo. (F) Exemplary flow cytometry data of indicated cytokines and surface marker shown for CD8+ T cells for one donor after complete vaccination (BNT162b2 x BNT162b2) with an mRNA vaccine. (G) Proportion of samples with nonfunctional (0), monofunctional (1), bifunctional (2), or trifunctional (3) spike-specific CD8+ T cells after complete vaccination. T cell responses were considered positive if the detected frequency of cytokine-positive CD4+ or CD8+ T cells was ≥3-fold higher than the frequency in the negative control and at least 0.1% of total CD4+ or CD8+ T cells. Responders are represented by colored symbols, and nonresponders are represented by clear symbols. Symbol shapes indicate the different vaccine products received by the donors. (A) Fisher’s exact test. (B and E) Box plots show the median with the 25th and 75th percentiles, and whiskers represent the minimum and maximum; Kruskal-Wallis test was used. If P values are not shown, then the results were not significant. FSC, forward scatter; FITC, fluorescein isothiocyanate.

