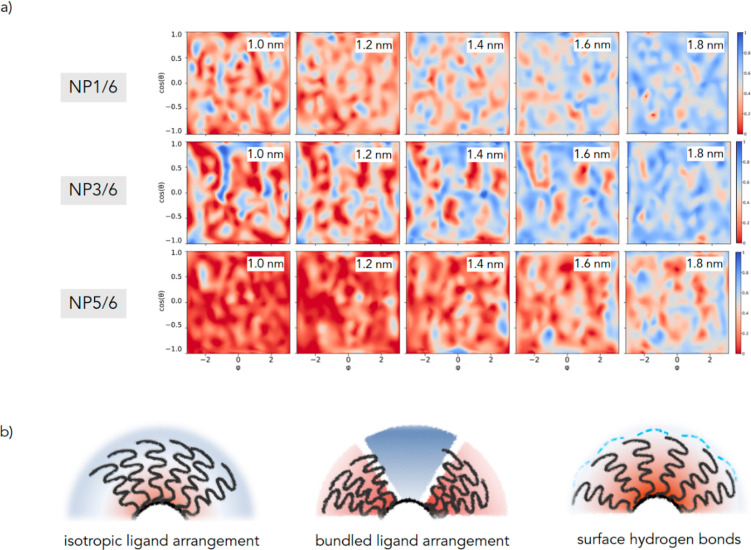
Figure 4.
(a) Normalized water distribution at increasing distance from the gold surface for NP1/6, NP3/6, and NP5/6. The graphs plot the distribution of the atom (oxygen of water or carbon of thiolates) closest to gold surface (centered on the gold core and placed at increasing distances from its surface) shown as a two-dimensional projection of the sphere surface (x-axis, the azimuthal angle φ; y-axis, the cosine of the polar angle θ). A value of 1 indicates that an oxygen atom of a water molecule is always the closest; if it is equal to 0, it indicates that a carbon/fluorine atom of a chain is always the closest. Simplifying, red to salmon areas represent poorly hydrated zones, while blue areas stand for highly hydrated parts of the monolayer (at a certain distance from the gold surface). At distances lower than those considered, the microenvironment is almost hydrophobic, while at higher distances, it is fully hydrated and no major difference between the monolayers could then be detected. Maps for NP2/6 and NP4/6 can be found in the SI (Figures S5 and S6). (b) Examples of possible different hydration states within SAMs.

