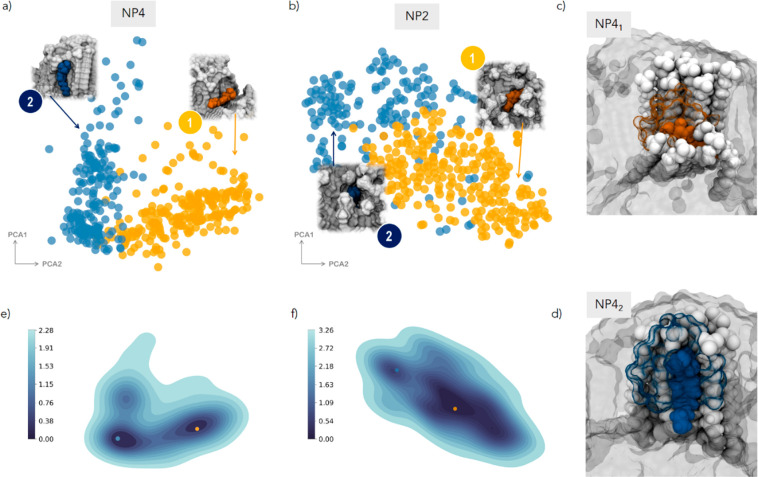
Figure 6.
First two principal components (PCA1 and PCA2) obtained from dimensionality reduction of the medium-range SOAP feature space of the probe 7 in thicker homoligand NP4 (a) and NP2 (b). Dots are colored according to the clusterization obtained by the GMM analysis. For each cluster, the inset shows the molecular environment centered on the probe 7, extracted from the corresponding MD frames. Color legend: probe, same color of the cluster; ligands 4 and 2 in gray; solvent not shown for clarity. (c, d) Example of the molecular view of the local environments NP41 and NP42 including all atoms within the cutoff r1. The reporter is colored according to the cluster assigned as a sphere; water is shown in the same color of the probe but as a transparent surface, and the ligands belonging to the environment are highlighted as white spheres. The remaining ligands are left as a background gray surface. (e, f) Free energy surface (FES) (kcal/mol) calculated from the state’s probability distribution in (a) and (b), respectively. Dots identify the minima on the FES and are colored based on the microstate (cluster) they refer to.

