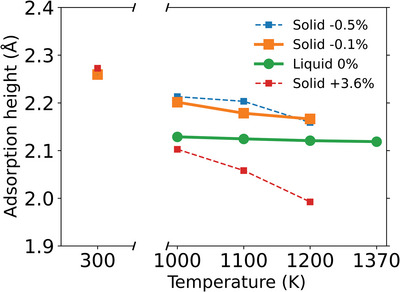
Figure 4.

The inflection‐point gap of Gr on liquid Cu and solid Cu(111) (with different Gr‐sheet strains as indicated in the legend) against simulation temperature for the MTP@PBE+MBD potential. The −0.1% data points correspond to the gigantic c(27 × 27√3) simulation cell employed for the quantitative “gap” comparison with the experiment.
