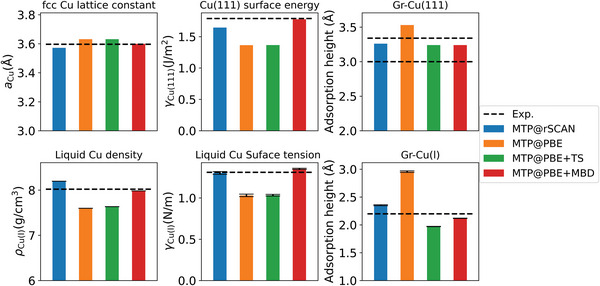
Figure 7.

Correlation in the performance of different levels of theory on analog observables of solid (upper panels) and liquid Cu (lower panels): (left panels) T = 0 K Cu fcc lattice constant (a Cu) versus liquid Cu density (ρ Cu(l)) at T = 1356 K (experimental melting temperature of Cu), (middle panels) T = 0 K Cu(111) surface energy (γ Cu(111) versus T = 1370 K liquid Cu tension (γ Cu(l), and (right panels) T = 0 K Gr—Cu(111) “gap” versus the T = 1370 K (experimental temperature in this work) Gr—Cu(l) “gap”. The computational uncertainties are shown by error bars. Experimental reference data are taken from Refs. [31, 34, 44, 45, 46, 47] and this work, see text. For the Gr—Cu(111) “gap” two experimental references are shown.
