
Figure 1.
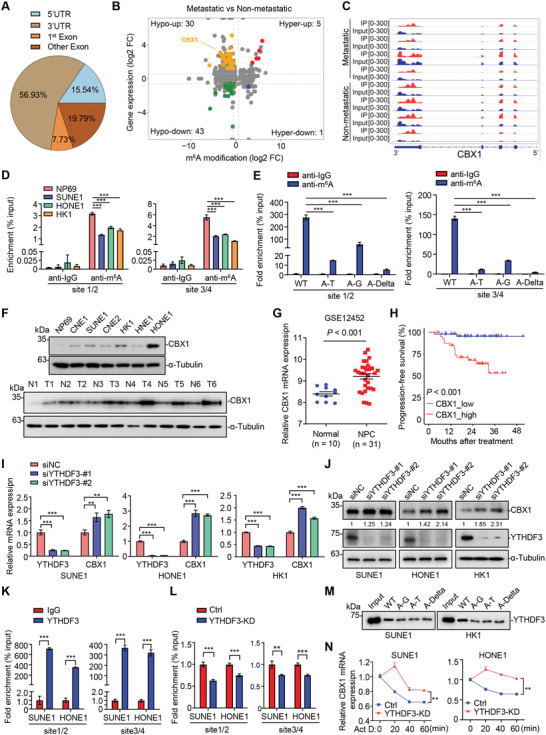
Identification of CBX1 as an m6A‐modified histone methylation regulator in NPC. A,B) m6A‐seq analysis in NPC biopsy tissue samples with (n = 4) or without (n = 4) metastasis. Distribution of genes with significantly altered m6A levels (|fold change| ≥ 1.5 and P < 0.05) and expression levels (|fold change| ≥ 1.5 and P < 0.05). C) m6A peaks were enriched in 3′UTR of CBX1 gene from m6A‐seq data. D) m6A‐RIP‐qPCR analysis of CBX1 m6A levels in NP69, SUNE1, HONE1, and HK1 cells. Mean (n = 3) ± s.d. One‐way ANOVA, *** P < 0.001. E) m6A‐RIP‐qPCR analysis of CBX1 m6A levels in HK1 cells transfected with WT, A‐T, A‐G, or A‐Delta CBX1 mRNA fragment constructs. Mean (n = 3) ± s.d. One‐way ANOVA, *** P < 0.001. F) Western blotting of CBX1 and α‐Tubulin in NP69, CNE1, CNE2, HK1, SUNE1, HONE1, and HNE1 cells. G) Relative mRNA levels of CBX1 in normal (n = 10) and NPC (n = 31) tissue samples in the GSE12452 dataset. H) Kaplan–Meier progression‐free survival rates for NPC patients having high CBX1 (red) or low CBX1 (blue) expression in the GSE102349 dataset. Log‐rank test. I) Relative mRNA levels of CBX1 and YTHDF3 in SUNE1, HONE1 or HK1 cells transfected with siRNA targeting NC (siNC) or YTHDF3 (siYTHDF3‐#1 or ‐#2). Mean (n = 3) ± s.d. One‐way ANOVA, ** P < 0.01, *** P < 0.001. J) Western blotting of CBX1, YTHDF3 and α‐Tubulin in SUNE1, HONE1 or HK1 cells transfected with siRNA targeting NC (siNC) or YTHDF3 (siYTHDF3‐#1 or ‐#2). K) RIP‐qPCR analysis of IgG and YTHDF3 occupation in CBX1 m6A sites in SUNE1 or HONE1 cells. Mean (n = 3) ± s.d. Student's t‐test, *** P < 0.001. L) RIP‐qPCR analysis of YTHDF3 occupation in CBX1 m6A sites in SUNE1 or HONE1 cells transfected with siRNA targeting NC (Ctrl) or YTHDF3 (YTHDF3‐KD). Mean (n = 3) ± s.d. Student's t‐test, *** P < 0.001. M) Western blotting of the interaction of YTHDF3 with WT, A‐G, A‐T or A‐Delta CBX1 mRNA fragments from RNA pulldown assays using SUNE1 or HK1 cell lysates. N) Relative mRNA levels of CBX1 in SUNE1 or HONE1 cells transfected with siRNA targeting NC (siNC) or YTHDF3 (siYTHDF3‐KD) followed by treatment with actinomycin D (1 µg mL−1) by indicated time. Mean (n = 3) ± s.d. Two‐way ANOVA, ** P < 0.01.