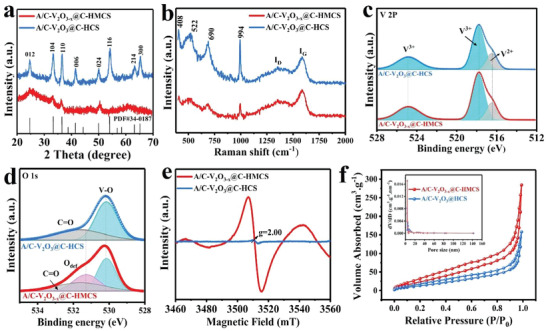
Figure 3.

Phase, composition, and pore structure characterizations of A/C‐V2O3@C‐HCS, and A/C‐V2O3− x @C‐HMCS. a) XRD pattern, b) Raman spectra, c) high‐resolution XPS spectra of V 2p, and d) O 1s. e) EPR spectra. f) N2 adsorption/desorption isotherms; inset, the corresponding pore size distribution.
