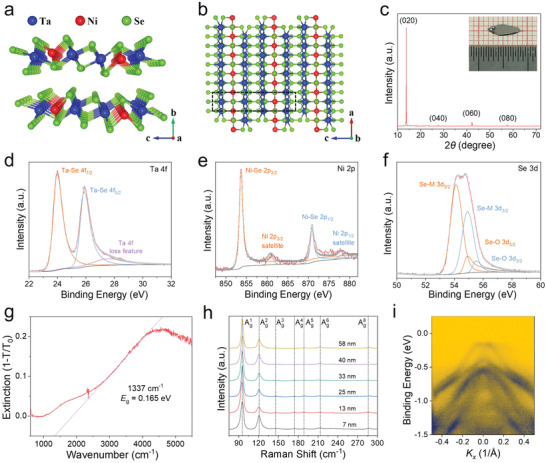
Figure 1.

Characterizations of the Ta2NiSe5 single crystals. a) Atomic structure of the Ta2NiSe5 stacked along the b axis. b) Top view of crystallographic structure of the Ta2NiSe5. c) XRD pattern of the Ta2NiSe5 crystals. Inset shows the optical image of the Ta2NiSe5 single crystal. d–f) High‐resolution XPS spectra of Ta 4f, Ni 2p, and Se 3d core regions in the Ta2NiSe5 crystal, respectively. g) FTIR absorption spectrum of the mechanically exfoliated Ta2NiSe5 nanosheets. h) Raman spectra of the Ta2NiSe5 nanoflake with different thickness. i) Band structure of the Ta2NiSe5 single crystal measured by ARPES at T = 300 K along the – direction.
