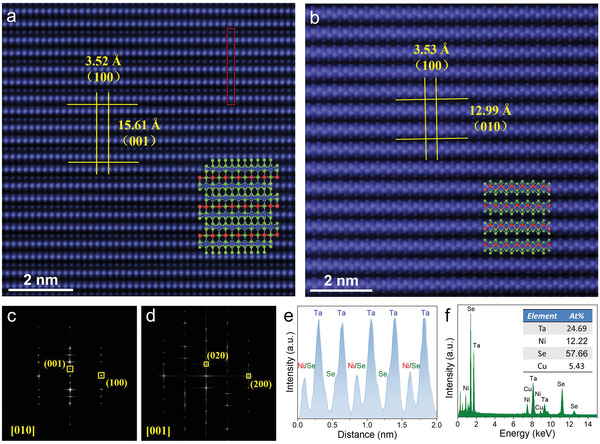
Figure 2.

Microscopic atomic structure of the synthesized Ta2NiSe5. a,b) Top surface and cross‐section High‐magnification STEM image of the Ta2NiSe5 nanosheet (zone axis = [010] and [001]), respectively. Inset is the atomic structure diagram of Ta2NiSe5. c,d) Corresponding FFT diffraction pattern of top surface and cross‐section STEM image. e) Intensity line profile of the atomic image for red rectangle dashed box in (a). f) EDX spectroscopy of the Ta2NiSe5 nanosheet. Inset is the atomic ratio of Ta, Ni, and Se.
