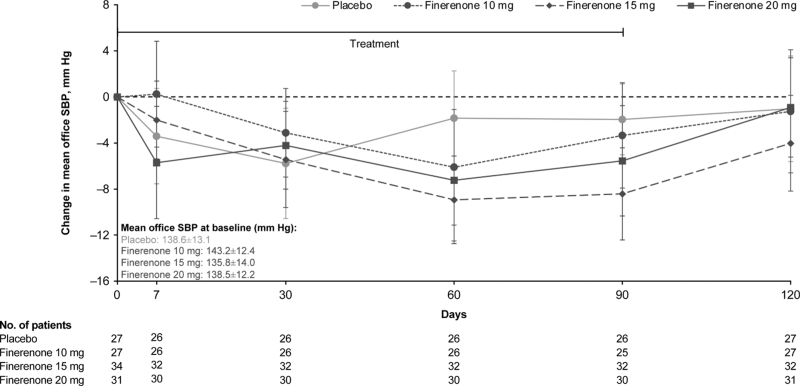
FIGURE 1.
Time course of change in office SBP. Change in office SBP from baseline to Day 120 with finerenone compared with placebo. Mixed model analysis with factors treatment group, time, baseline value, and treatment ∗ time interaction as covariates. Data are expressed as LS mean change from baseline ± 95% CI. CI, confidence interval; LS, least-squares; SBP, systolic blood pressure.

