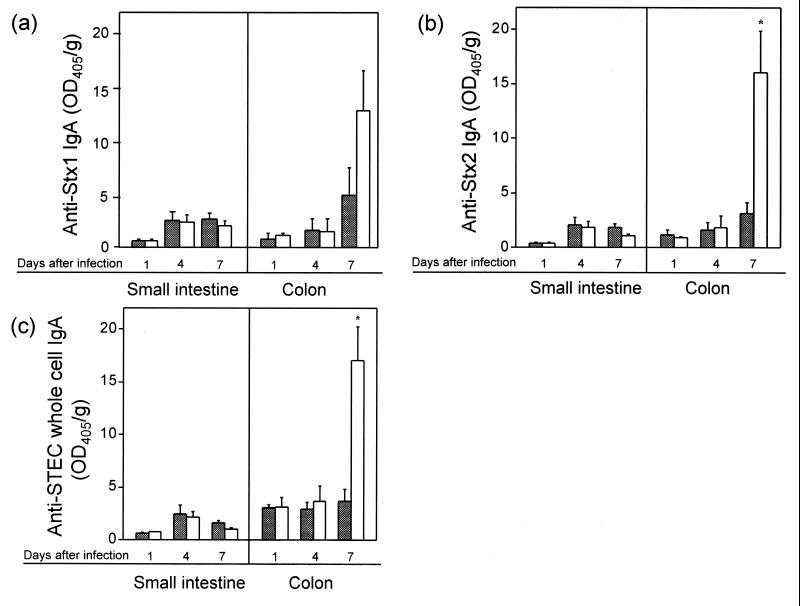
FIG. 3.
Changes in concentrations of IgAs against Stx1 (a), Stx2 (b), and STEC cells (c) in the intestinal contents of control (hatched columns) and L. casei-treated (white columns) rabbits. Concentrations of anti-Stx and anti-STEC bacterial cell surface antigen IgA in each homogenate were assayed as described in Materials and Methods. Three rabbits from both groups on day 1 after infection, 6 control and 7 L. casei-treated rabbits on day 4, and 8 control and 11 L. casei-treated rabbits on day 7 were examined. An asterisk indicates significant difference (P < 0.05) from the value for the corresponding control group as calculated by Student's t test.

