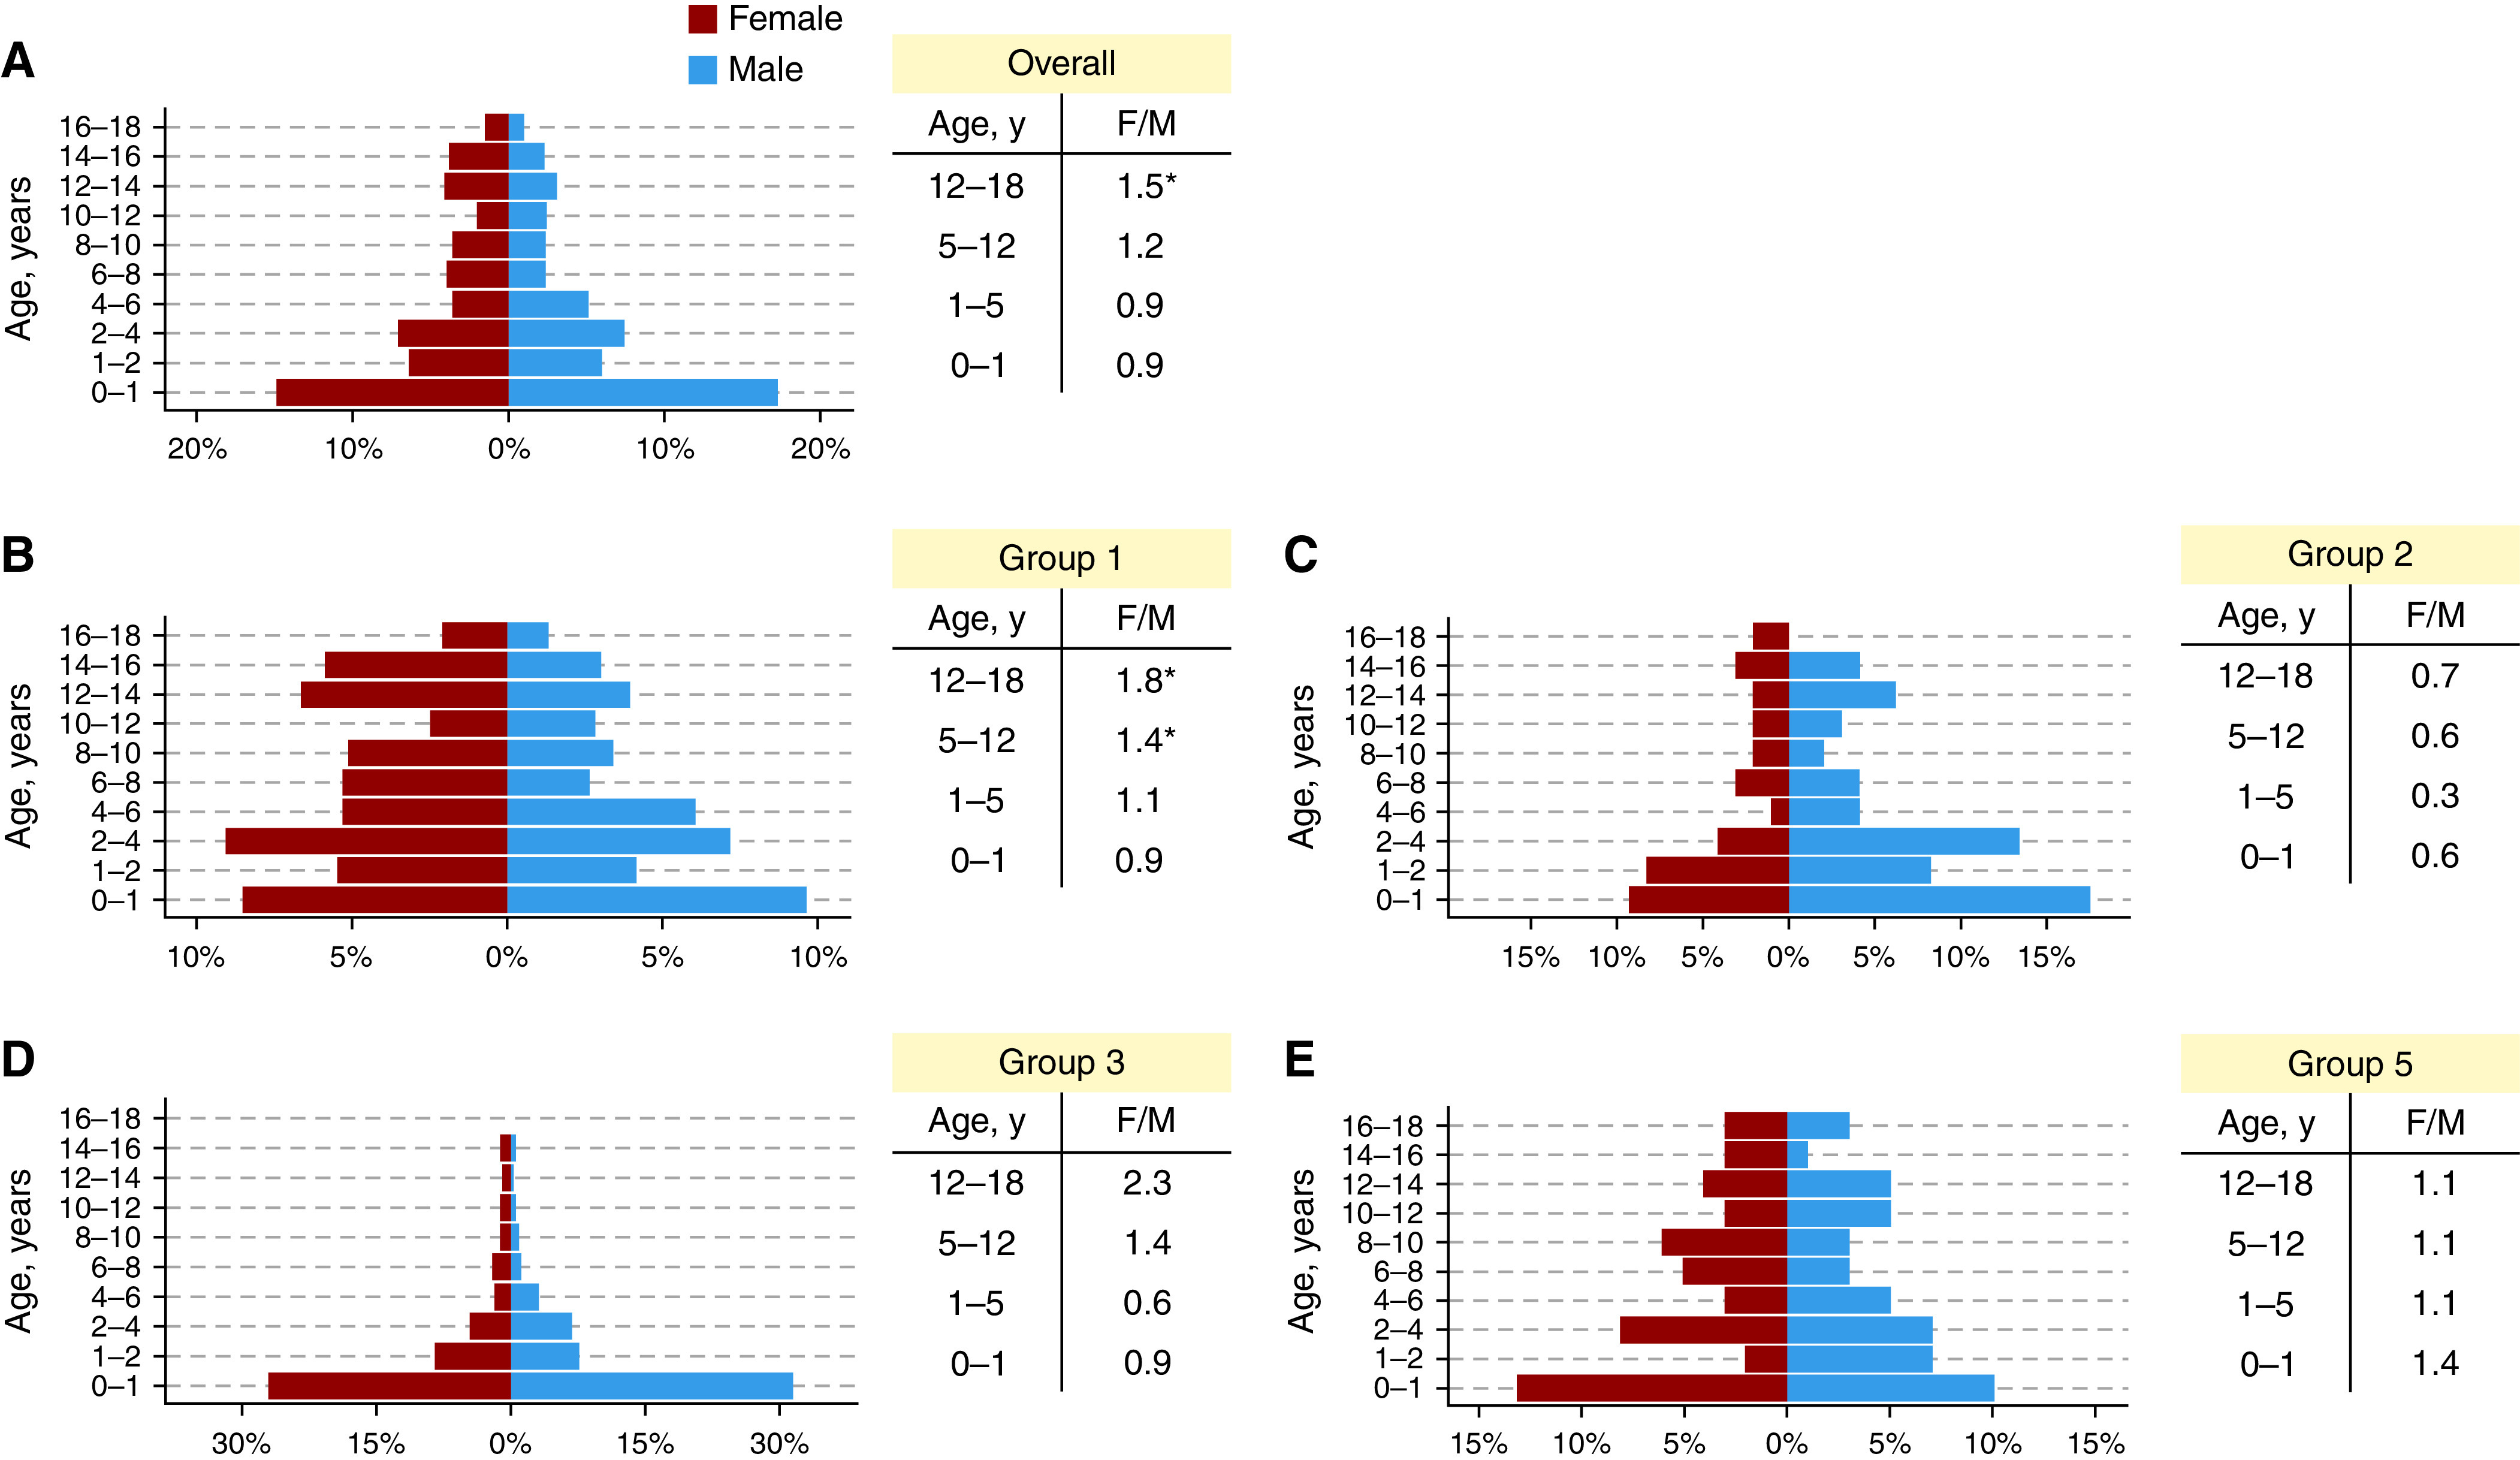
Figure 1.

(A–E) Diagnoses by age for the overall pulmonary hypertension cohort (A) and for pulmonary hypertension groups 1, 2, 3, and 5 (B–E) with corresponding sex ratios for infancy, young childhood, middle childhood, and adolescence. *P < 0.05 on chi-square testing compared with expected childhood sex ratio in the United Kingdom.
