Figure 3.

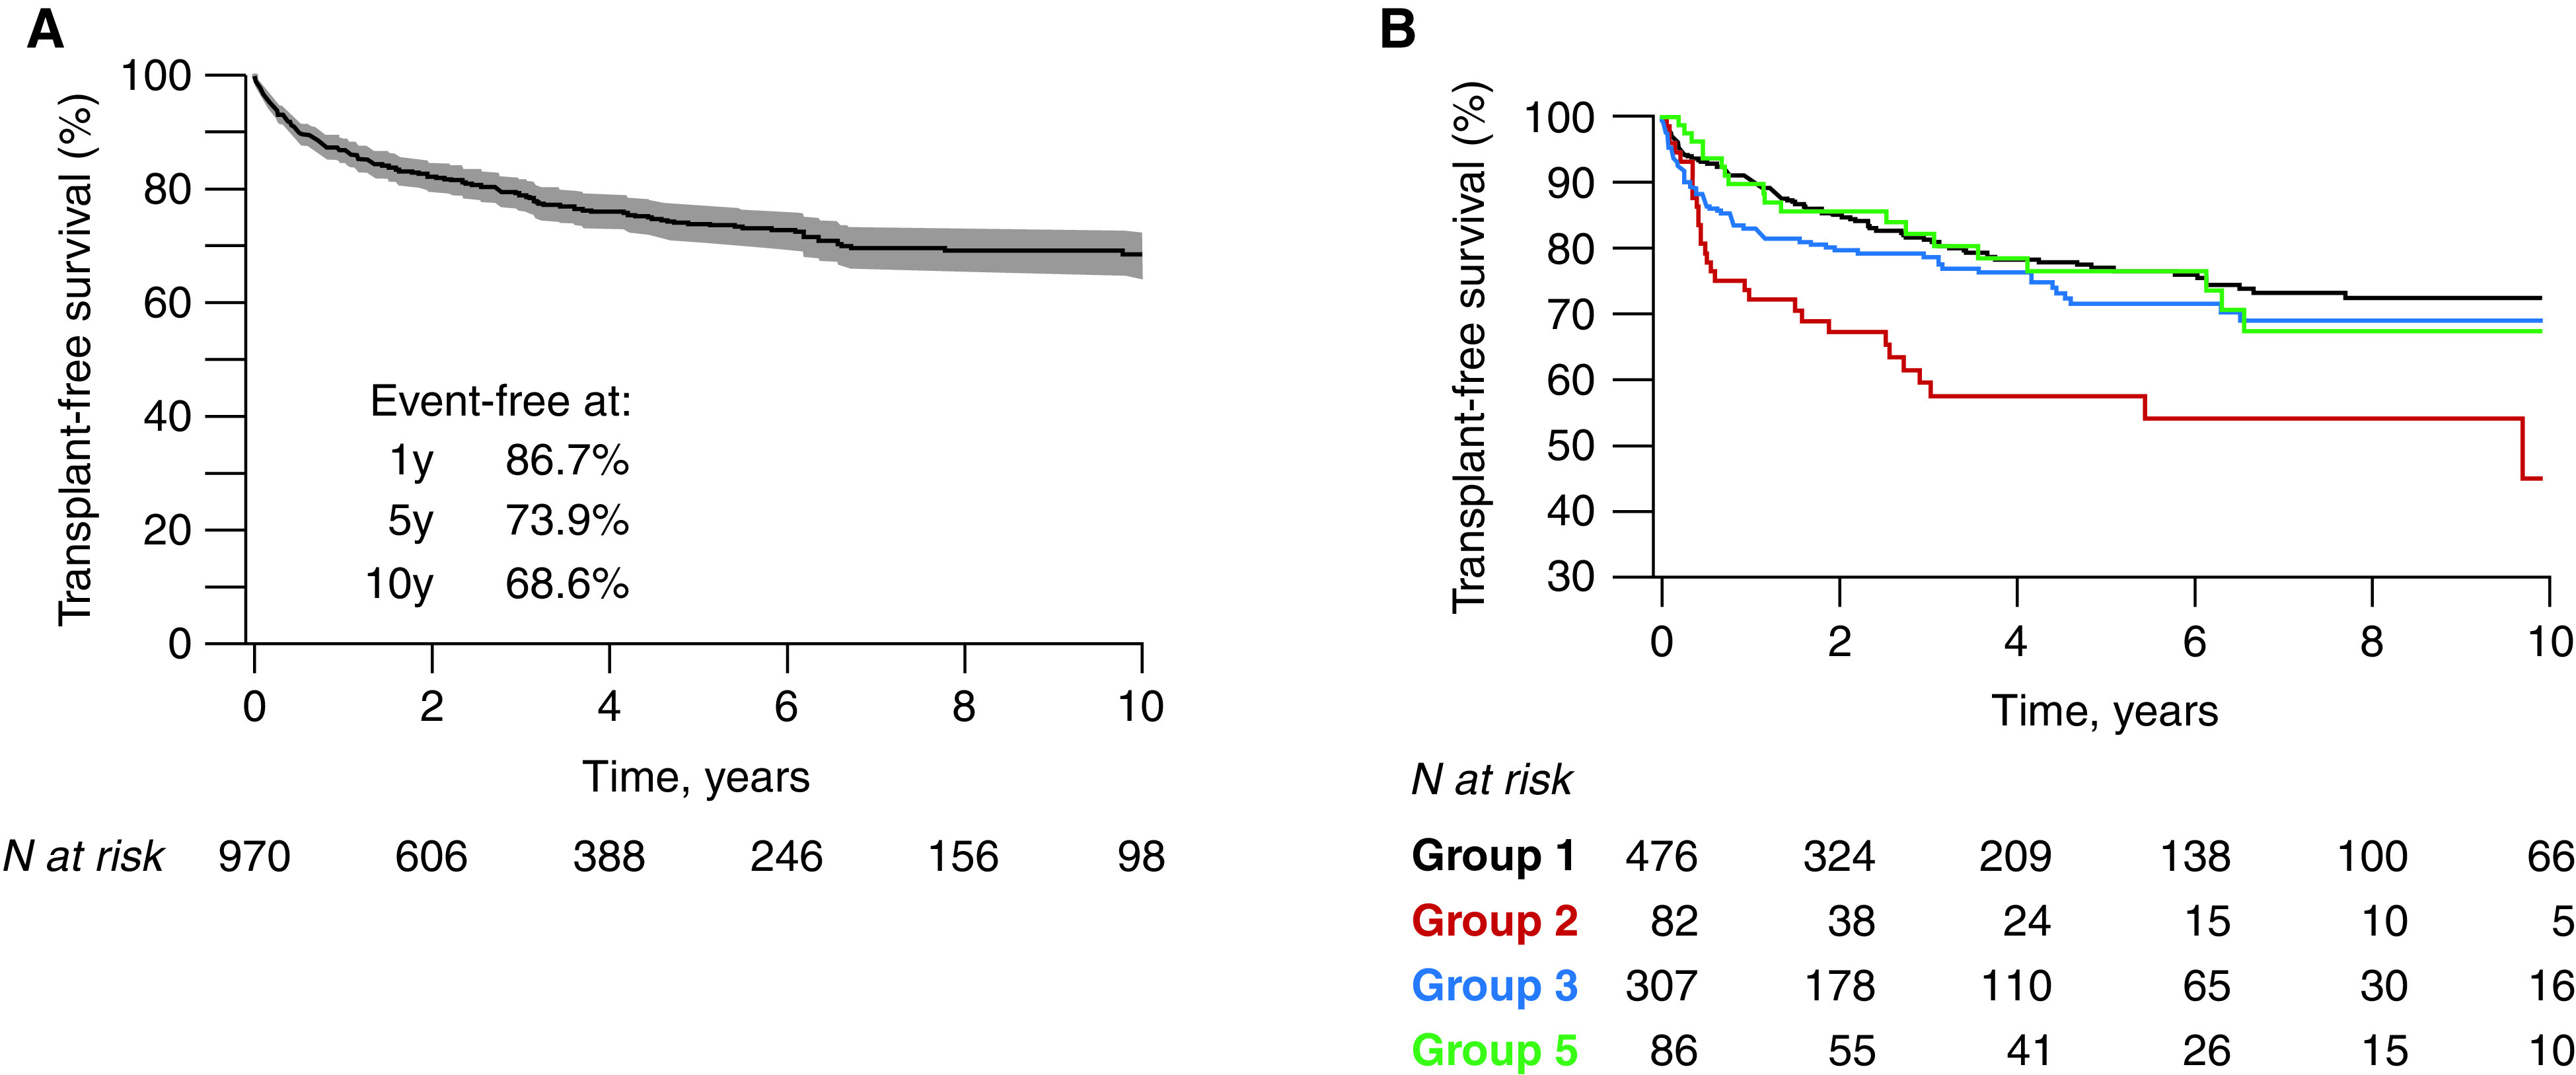
Kaplan-Meier survival curves in children with pulmonary hypertension, (A) in the overall cohort and (B) for the different pulmonary hypertension groups. The numbers below the horizontal axis represent the number of patients at risk.

Kaplan-Meier survival curves in children with pulmonary hypertension, (A) in the overall cohort and (B) for the different pulmonary hypertension groups. The numbers below the horizontal axis represent the number of patients at risk.