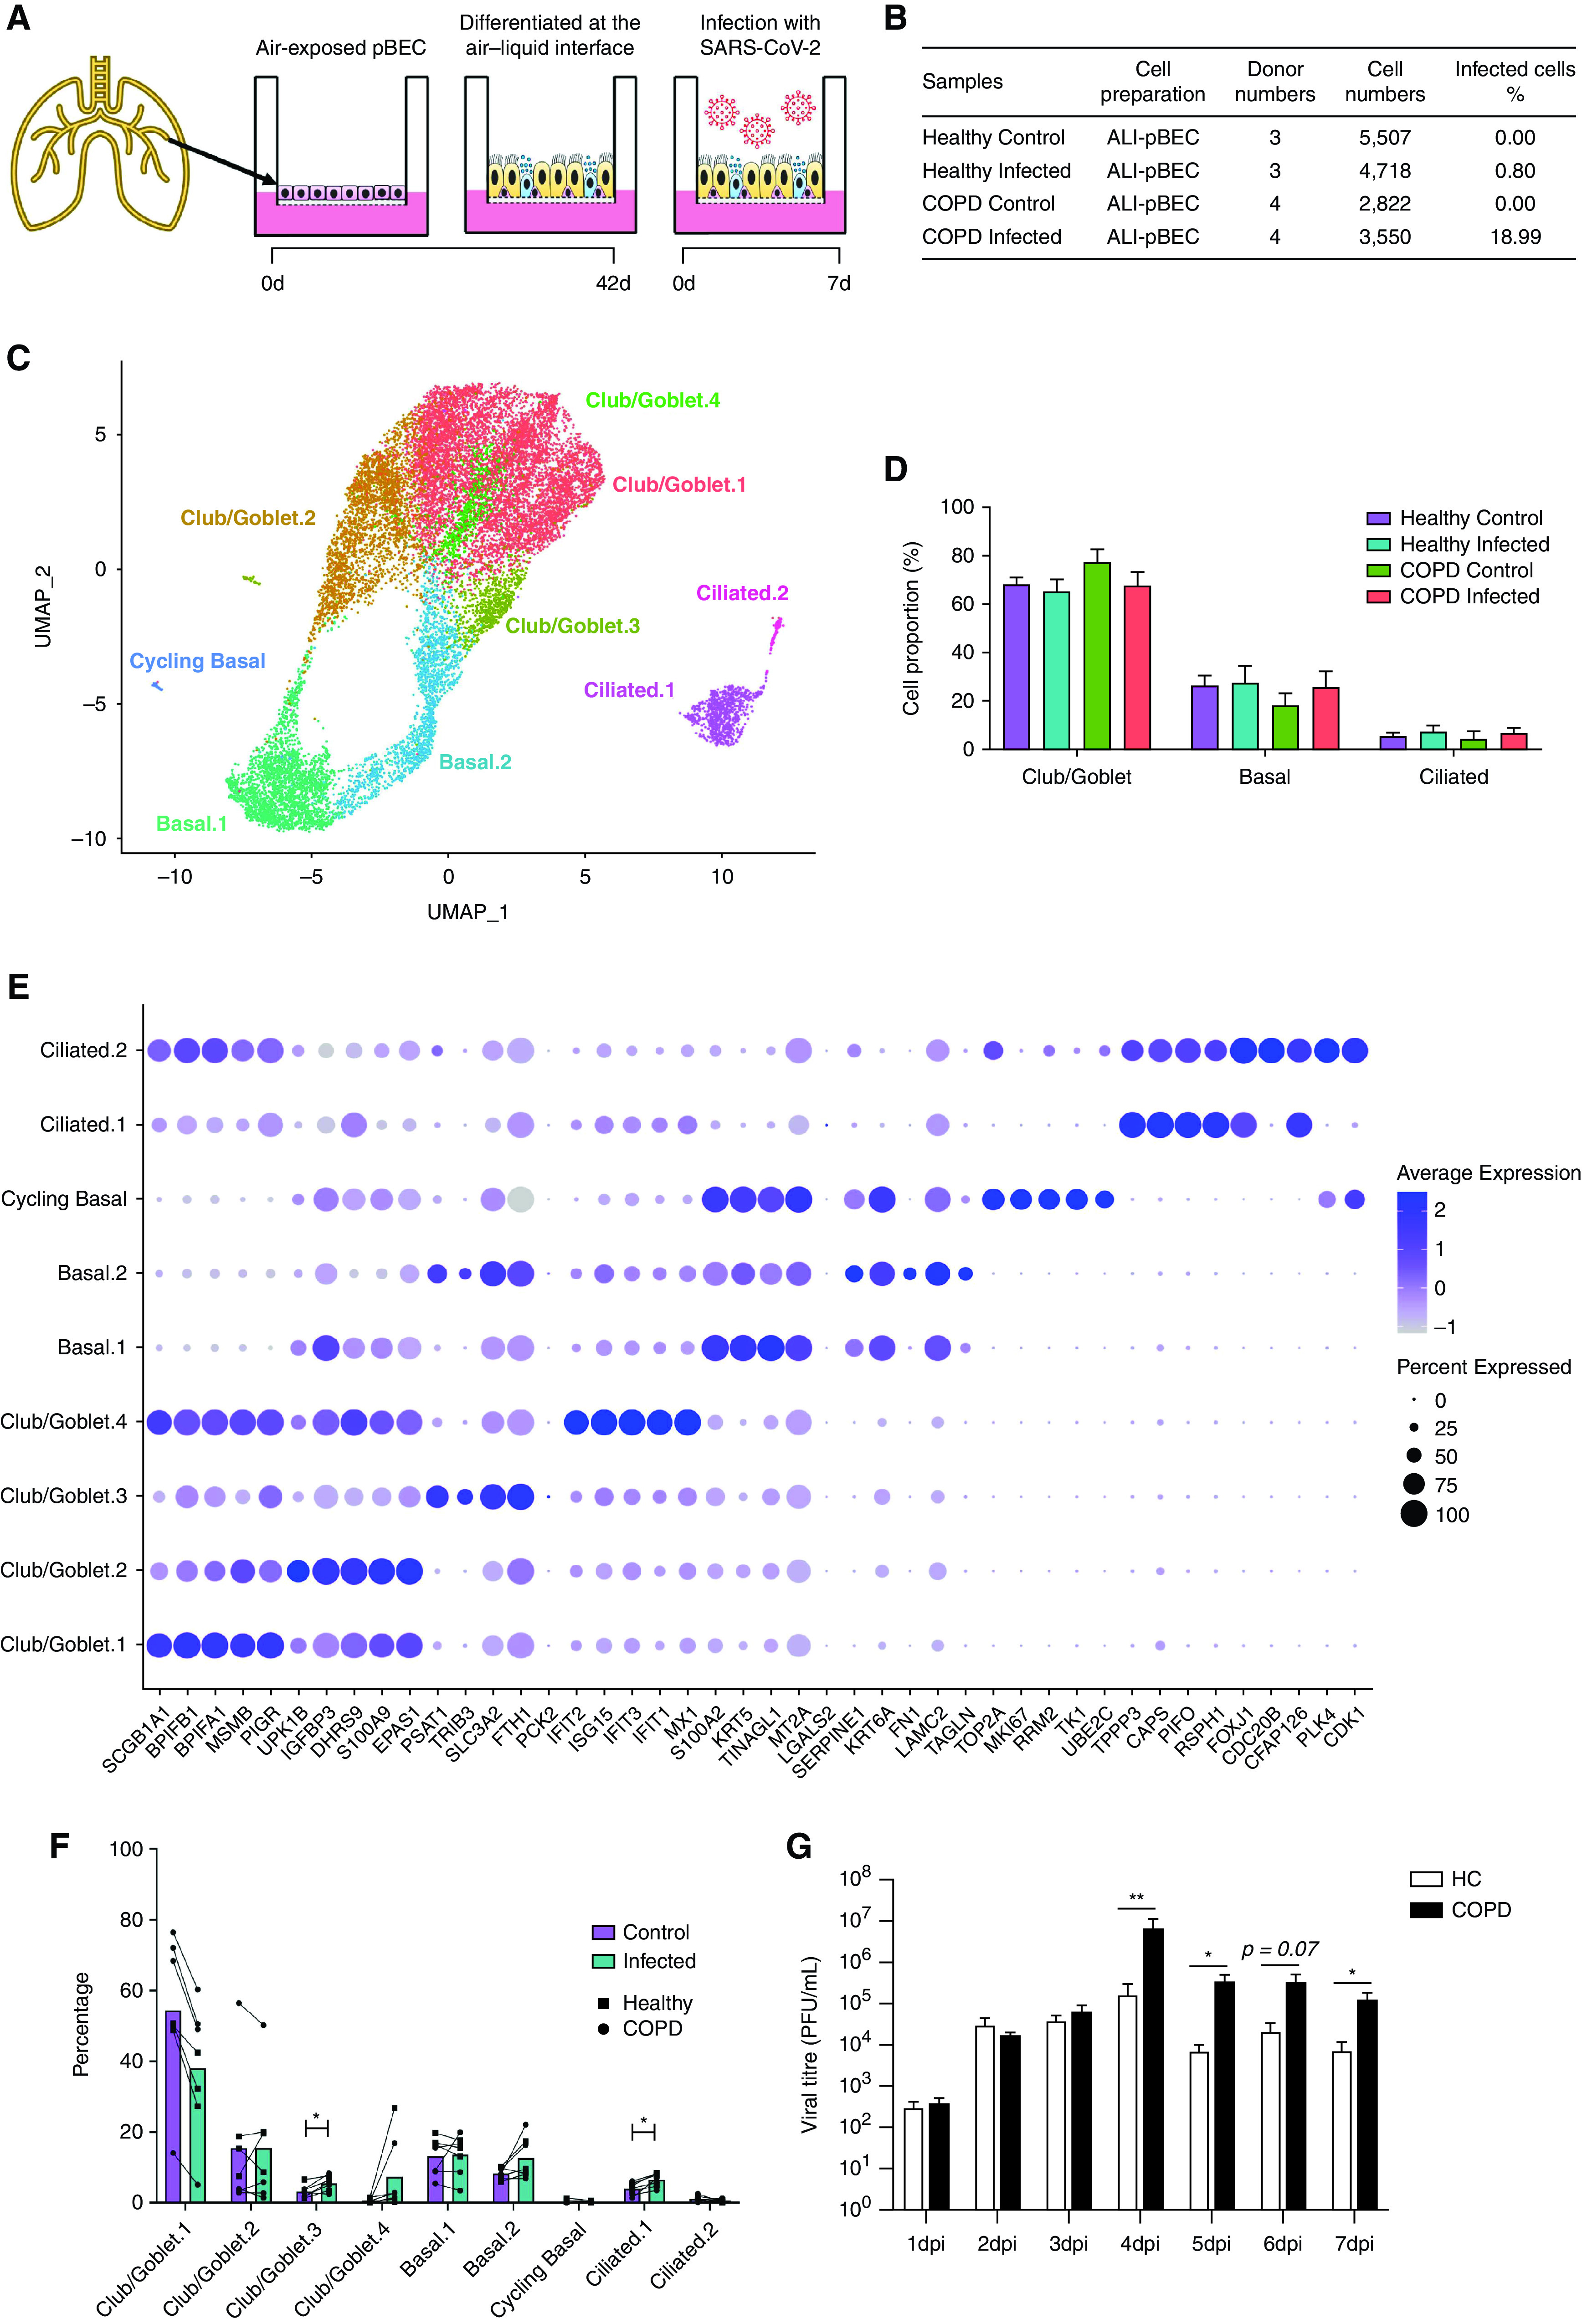
Figure 1.

scRNAseq analysis of severe acute respiratory syndrome coronavirus 2 (SARS-CoV-2)-infected human primary bronchial epithelial cells (pBECs) differentiated at the air–liquid interface (ALI). (A) Experimental design of the SARS-CoV-2 infection of human pBECs differentiated ALI ex vivo. (B) Baseline characteristics of the samples showing cell numbers sequenced. (C) UMAP plot of the scRNAseq dataset identifying cell clusters. (D) Bar chart of proportions (in percentage) of major cell types (club/goblet, basal, and ciliated). (E) Cell proportions (in percentage) of control and infected healthy and chronic obstructive pulmonary disease (COPD) pBECs. (F) Average expression of the top five markers for each cluster. (G) Viral titers recovered from daily apical washes from COPD and healthy pBECs at ALI. Statistical differences between the groups are indicated whereby *P ⩽ 0.05 and **P ⩽ 0.01. HC = healthy control; scRNAseq = single-cell RNA sequencing; UMAP = uniform manifold approximation and projection.
