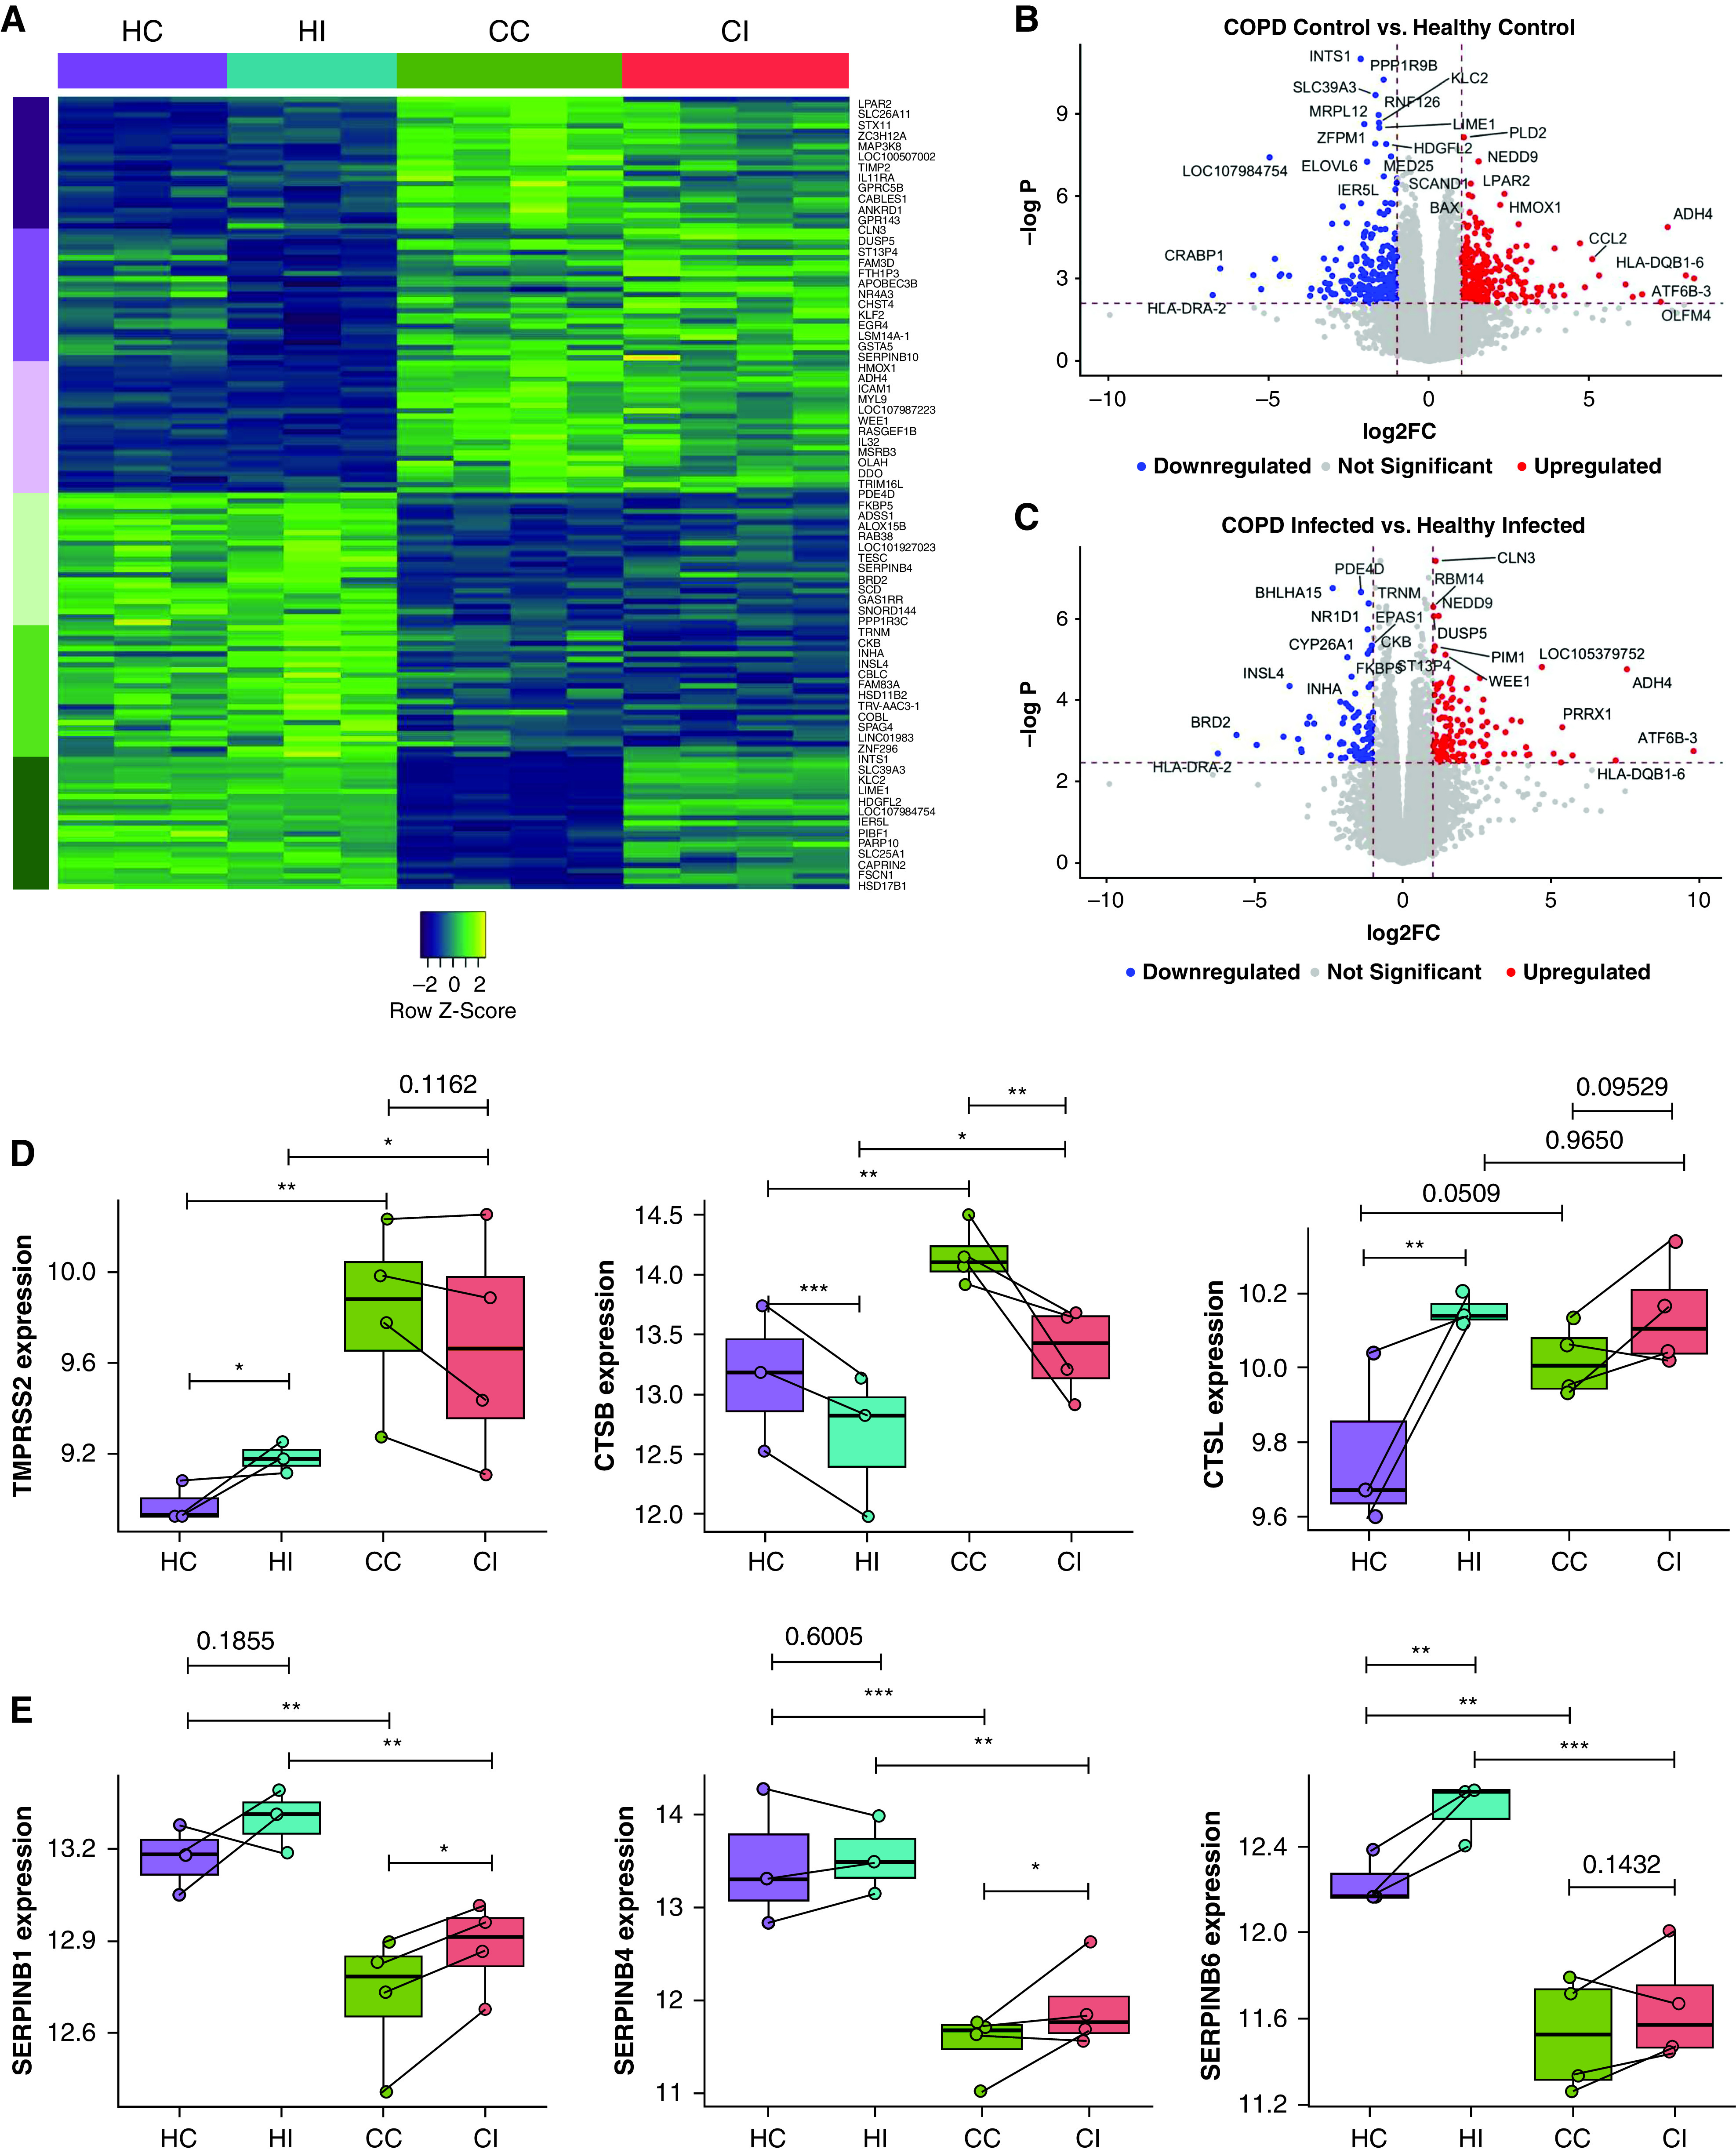
Figure 3.

Differential gene expression analysis between infected chronic obstructive pulmonary disease (COPD) and healthy primary bronchial epithelial cells. (A) Heatmap of the top 50 differentially upregulated genes in infected COPD compared with healthy cells. Columns are grouped by samples, and rows represent genes grouped by the top upregulated (purple) and downregulated (green) in each or both COPD groups. (B) Volcano plot of differentially expressed genes in sham-infected COPD and healthy cells. (C) Volcano plot of differentially expressed genes in infected COPD and healthy cells. Average expression of (D) protease genes involved in severe acute respiratory syndrome coronavirus 2 (SARS-CoV-2) entry (TMPRSS2, CTSB, and CTSL) and (E) protease inhibitor genes (SERPINB1, SERPINB4, and SERPINB6). Each dot represents a donor. Statistical differences between the groups are indicated by asterisks, in which *P ⩽ 0.05, **P ⩽ 0.01, and ***P ⩽ 0.001. CC = COPD control; CI = COPD infected; FC = fold change; HC = healthy control; HI = healthy infected.
