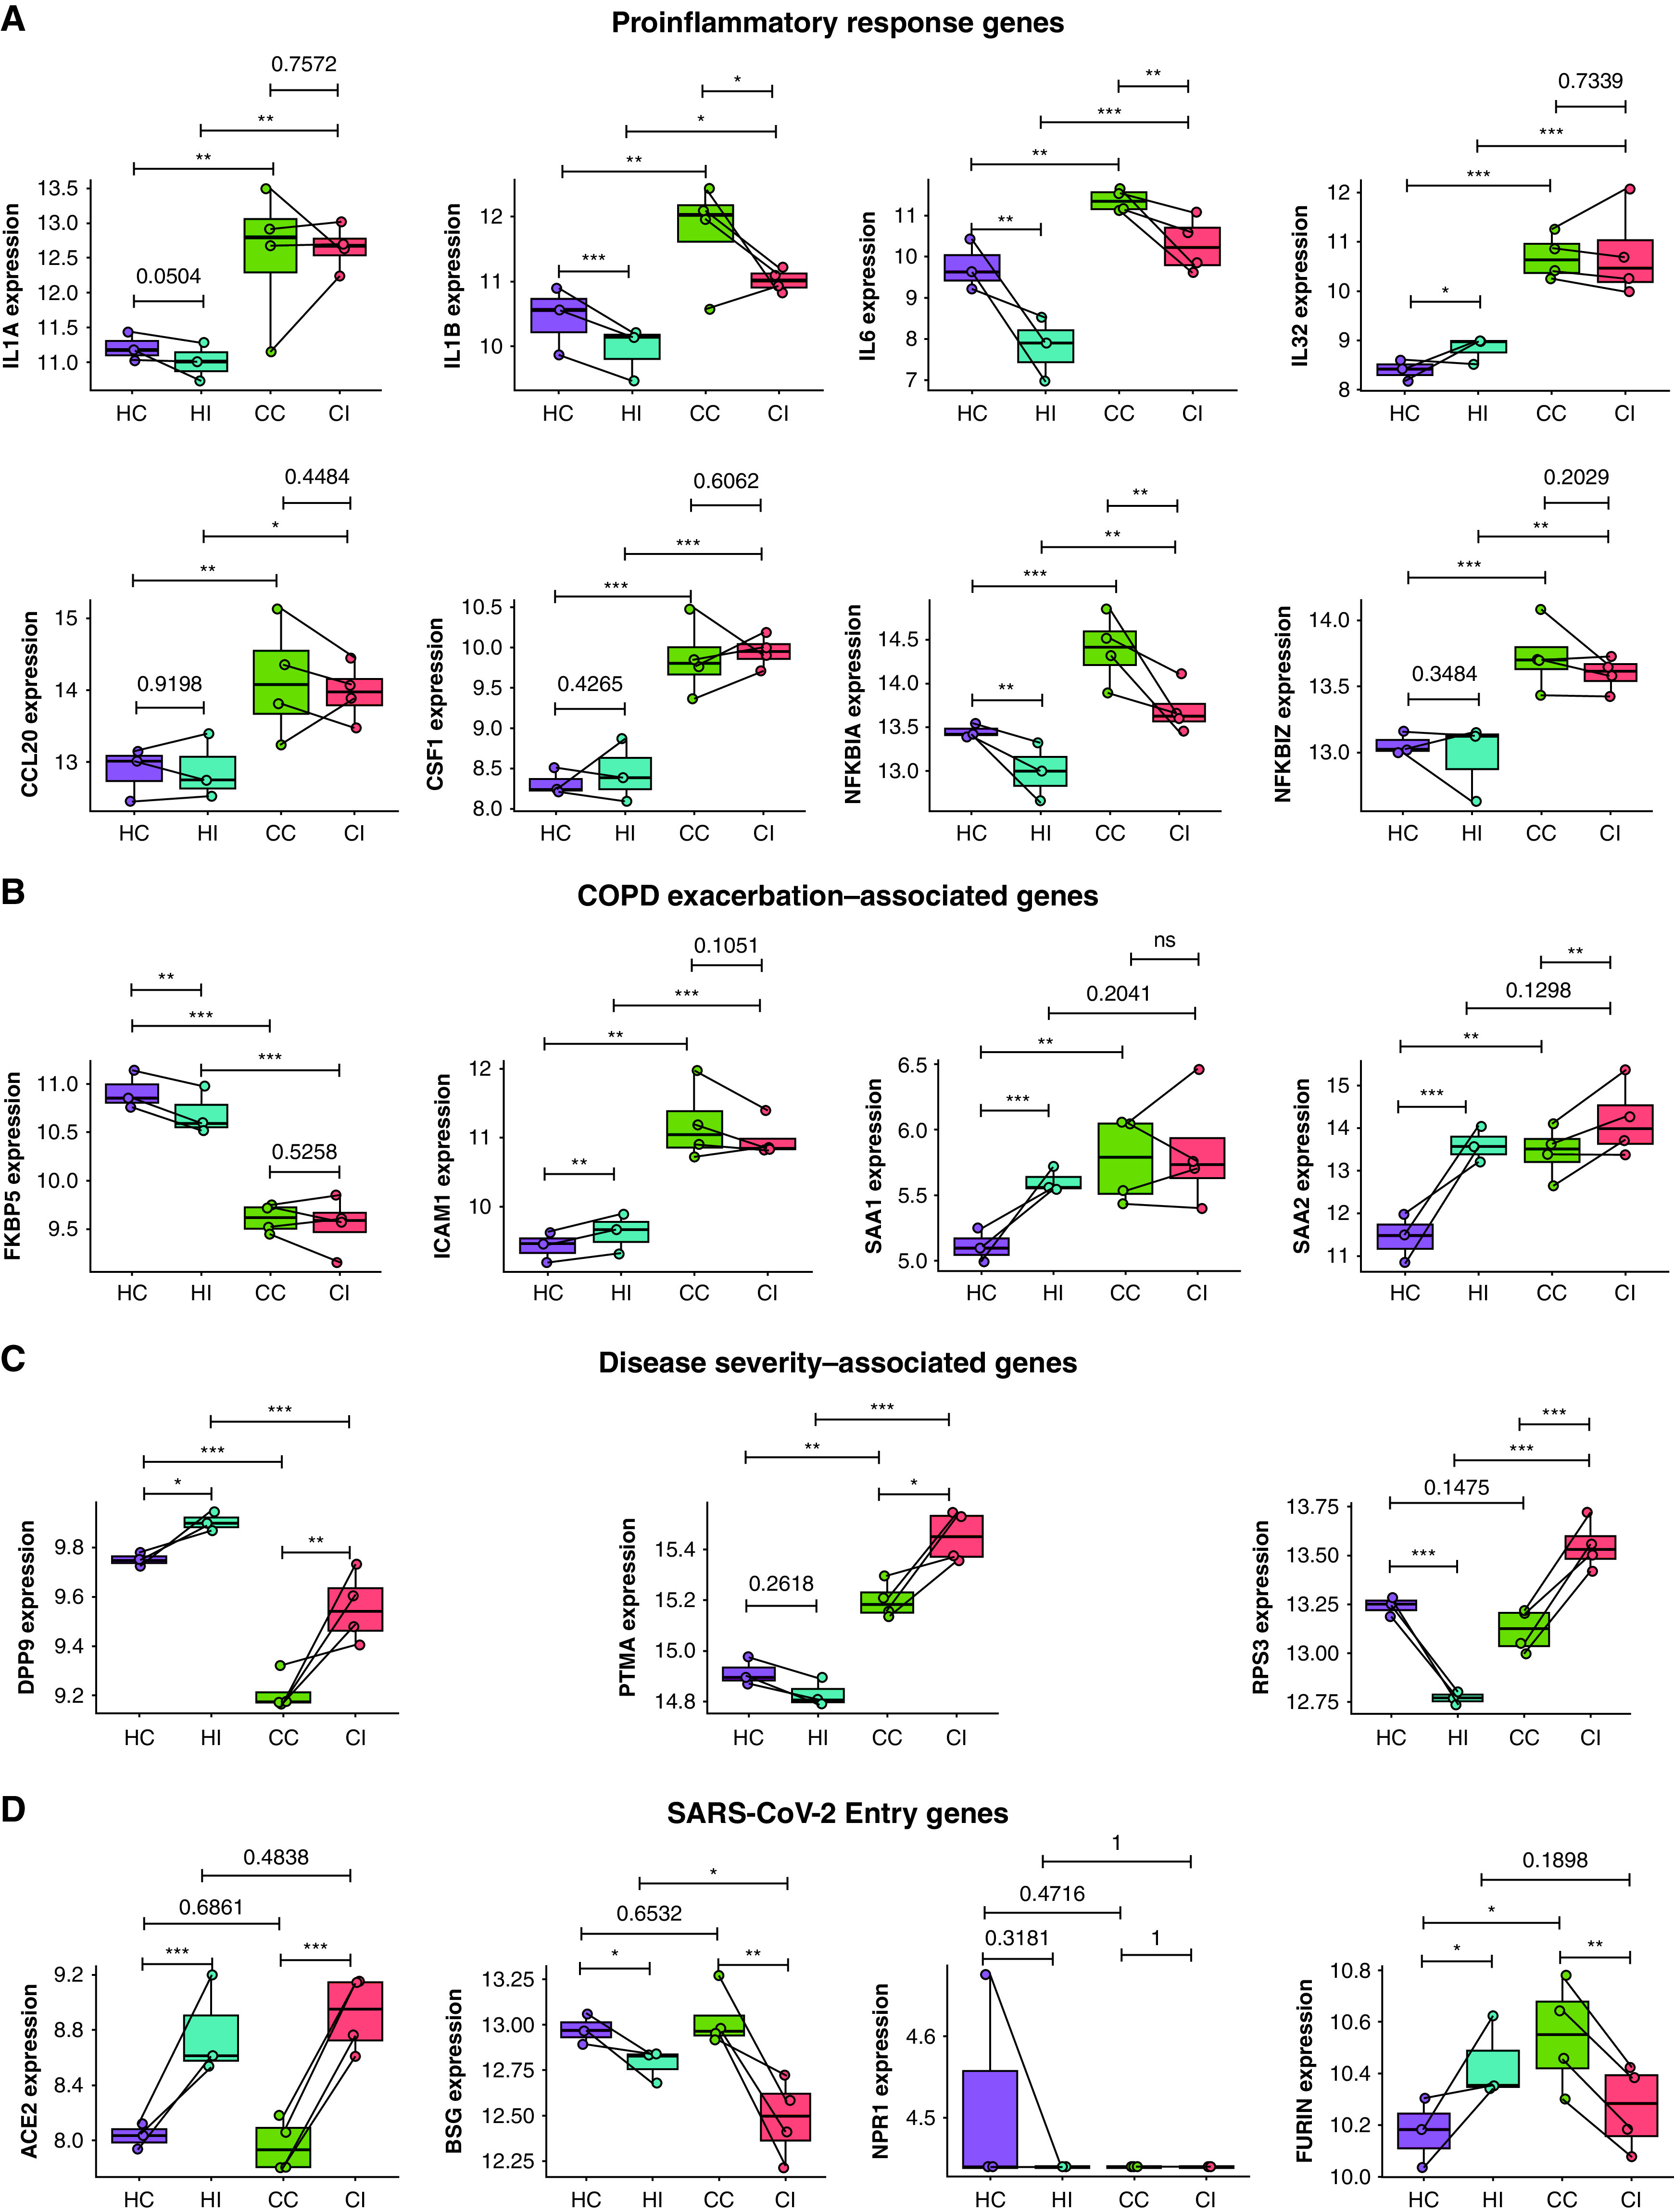
Figure 4.

Elevated proinflammatory, exacerbation, and disease severity genes and severe acute respiratory syndrome coronavirus 2 (SARS-CoV-2) entry genes in chronic obstructive pulmonary disease (COPD) compared with healthy primary bronchial epithelial cells. Average expression of (A) proinflammatory response genes (IL1A, IL1B, IL6, IL32, CCL20, CSF1, NFKBIA, and NFKBIZ), (B) COPD exacerbation–associated genes (FKBP5, ICAM1, SAA1, and SAA2), (C) disease severity–associated genes (DPP9, PTMA, and RPS3), and (D) known SARS-CoV-2 entry genes (ACE2, BSG, NPR1, and FURIN). Each dot represents a donor. Statistical differences between groups are indicated whereby *P ⩽ 0.05, **P ⩽ 0.01, and ***P ⩽ 0.001. CC = COPD control; CI = COPD infected; HC = healthy control; HI = healthy infected; ns = not significant.
