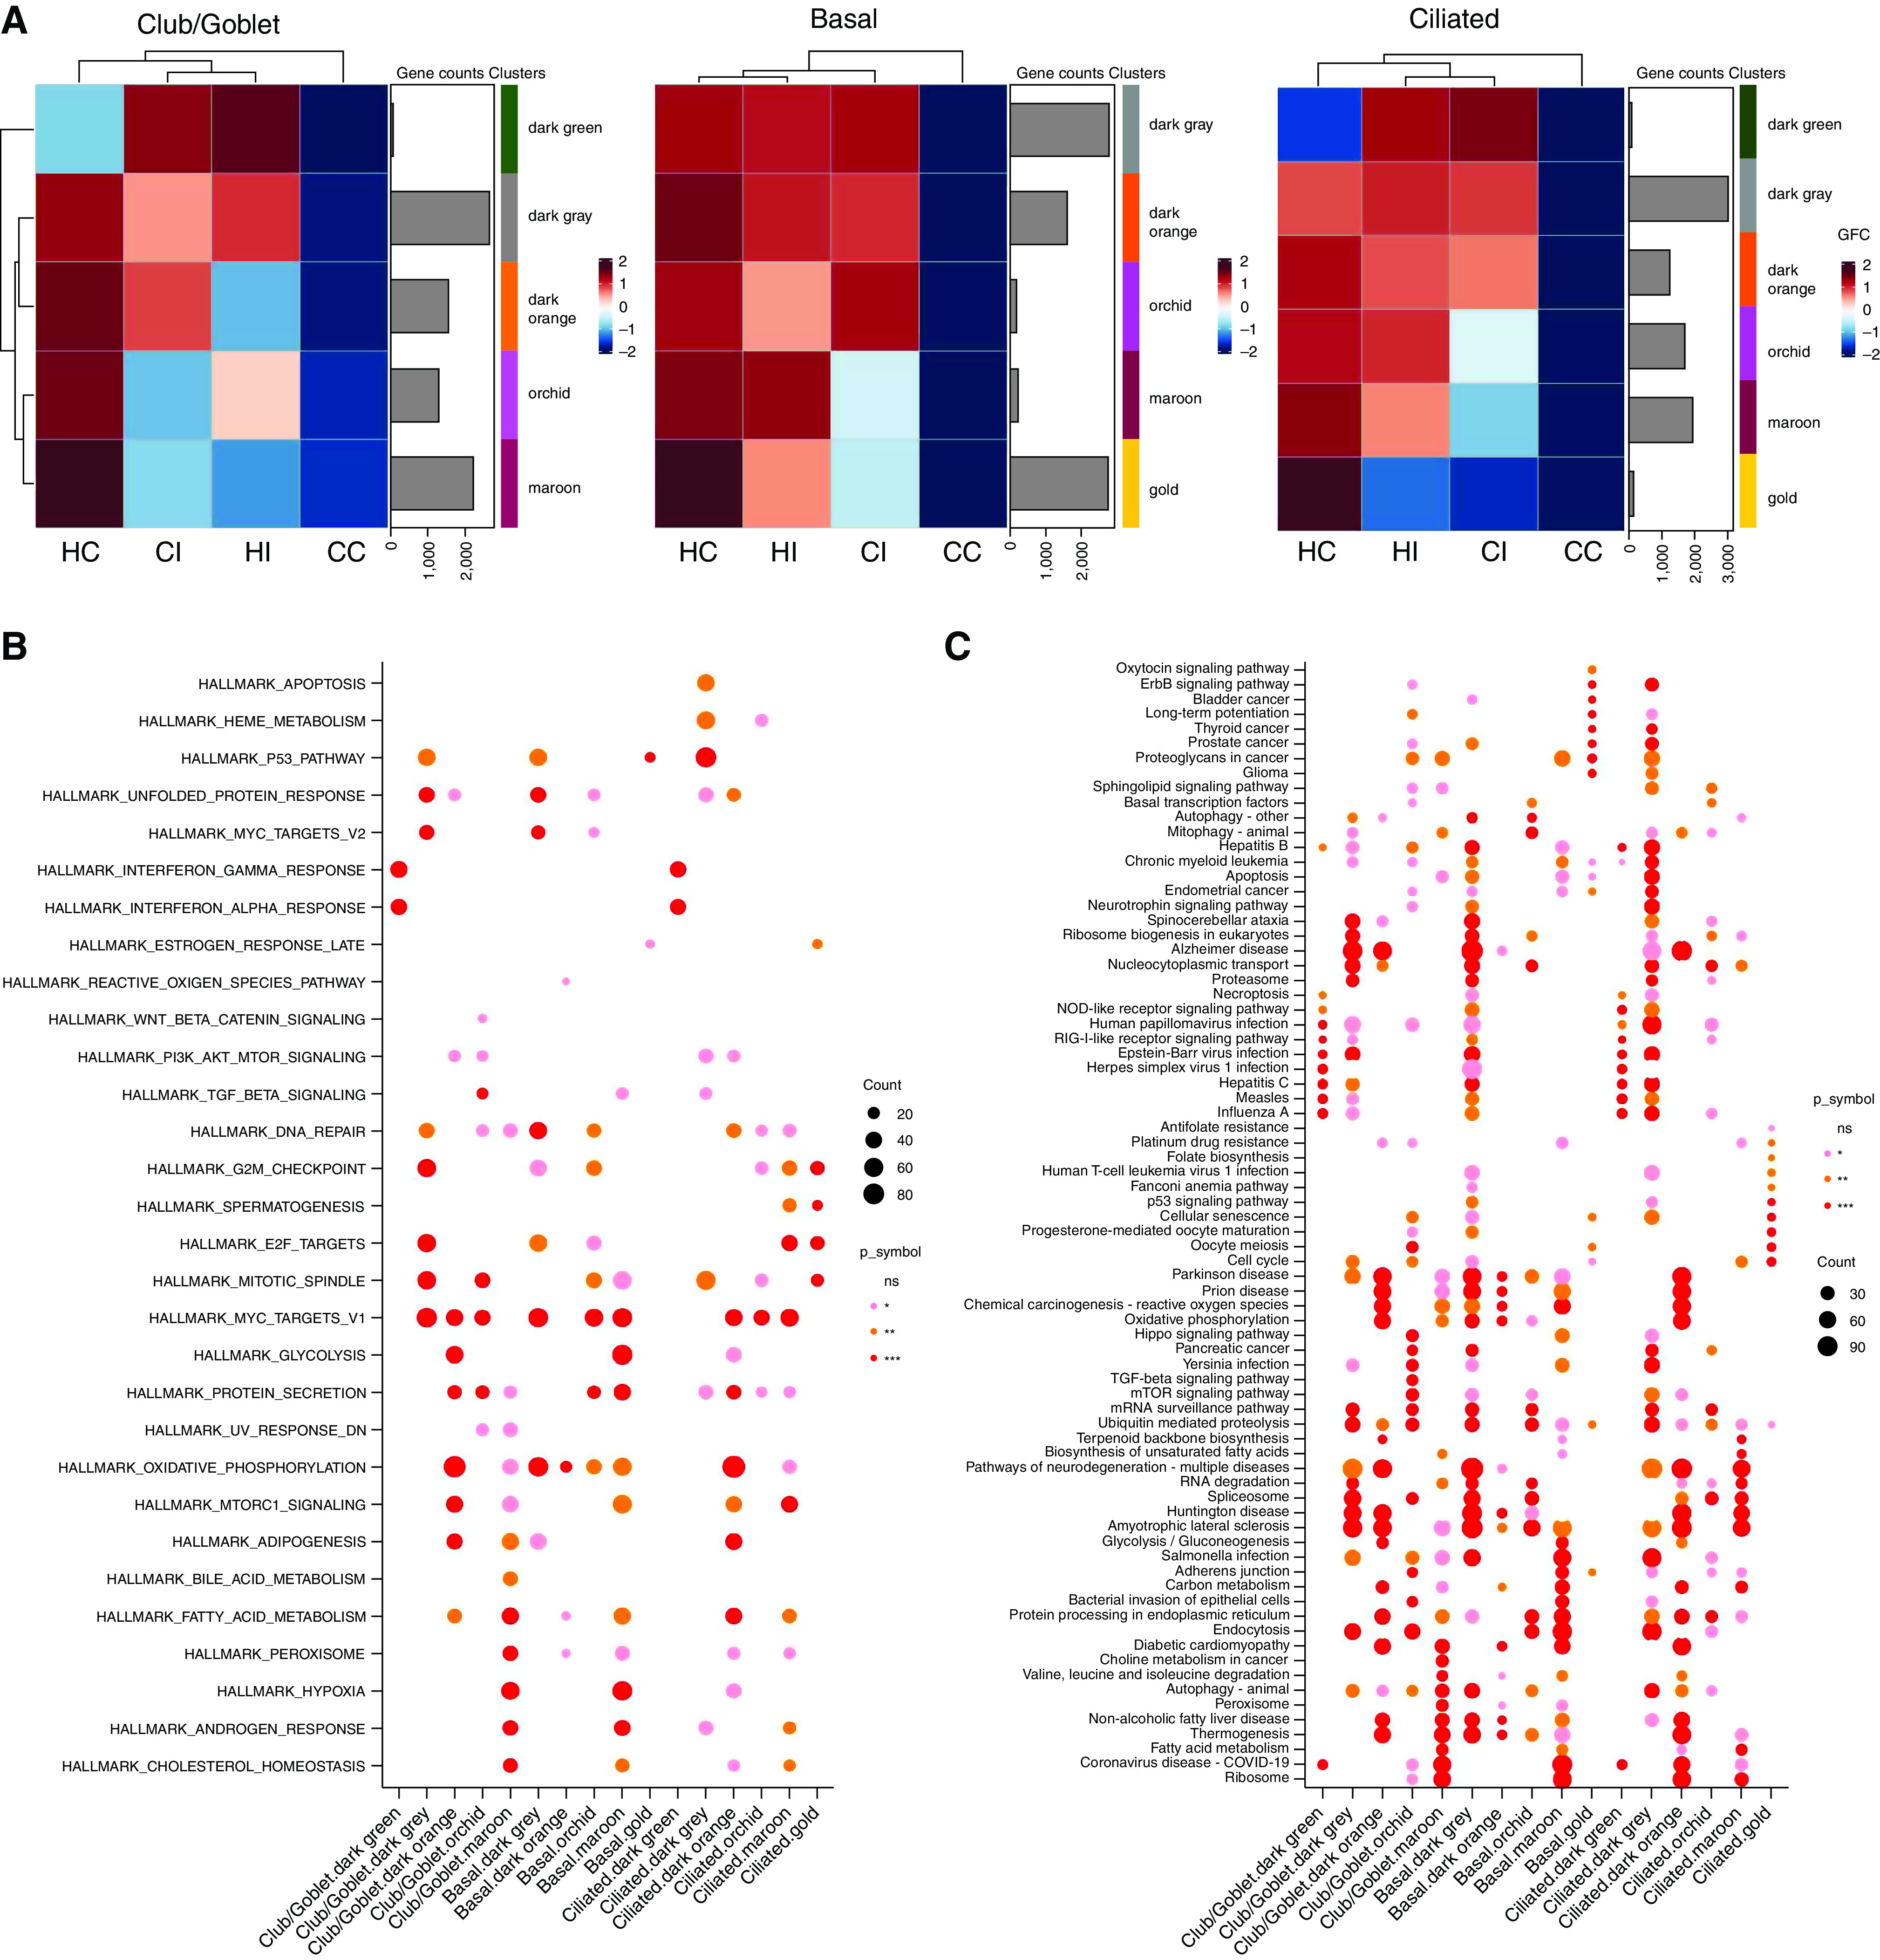
Figure 5.

Coexpression network analysis using the CoCeNa2 pipeline. (A) Coexpression network analysis was performed on the basis of club/goblet, basal, and ciliated cells. Heatmaps for the samples are colored on the basis of the group fold change, which is the mean expression of each gene in the module. (B) Hallmark and (C) KEGG (Kyoto Encyclopedia of Genes and Genomes) pathway analysis using the CoCeNa2 pipeline for each module. Top pathways for each module are shown. Statistical differences between groups are indicated by different colored symbols, in which pink dots represent P ⩽ 0.05, orange dots represent P ⩽ 0.01, red dots represent P ⩽ 0.001, and the absence of a dot represents nonsignificant pathways. The size of dots is proportional to the number of gene counts that are associated with the respective pathway. CC = COPD control; CI = COPD infected; COPD = chronic obstructive pulmonary disease; GFC = group fold change; HC = healthy control; HI = healthy infected; ns = not significant.
