Figure 6.


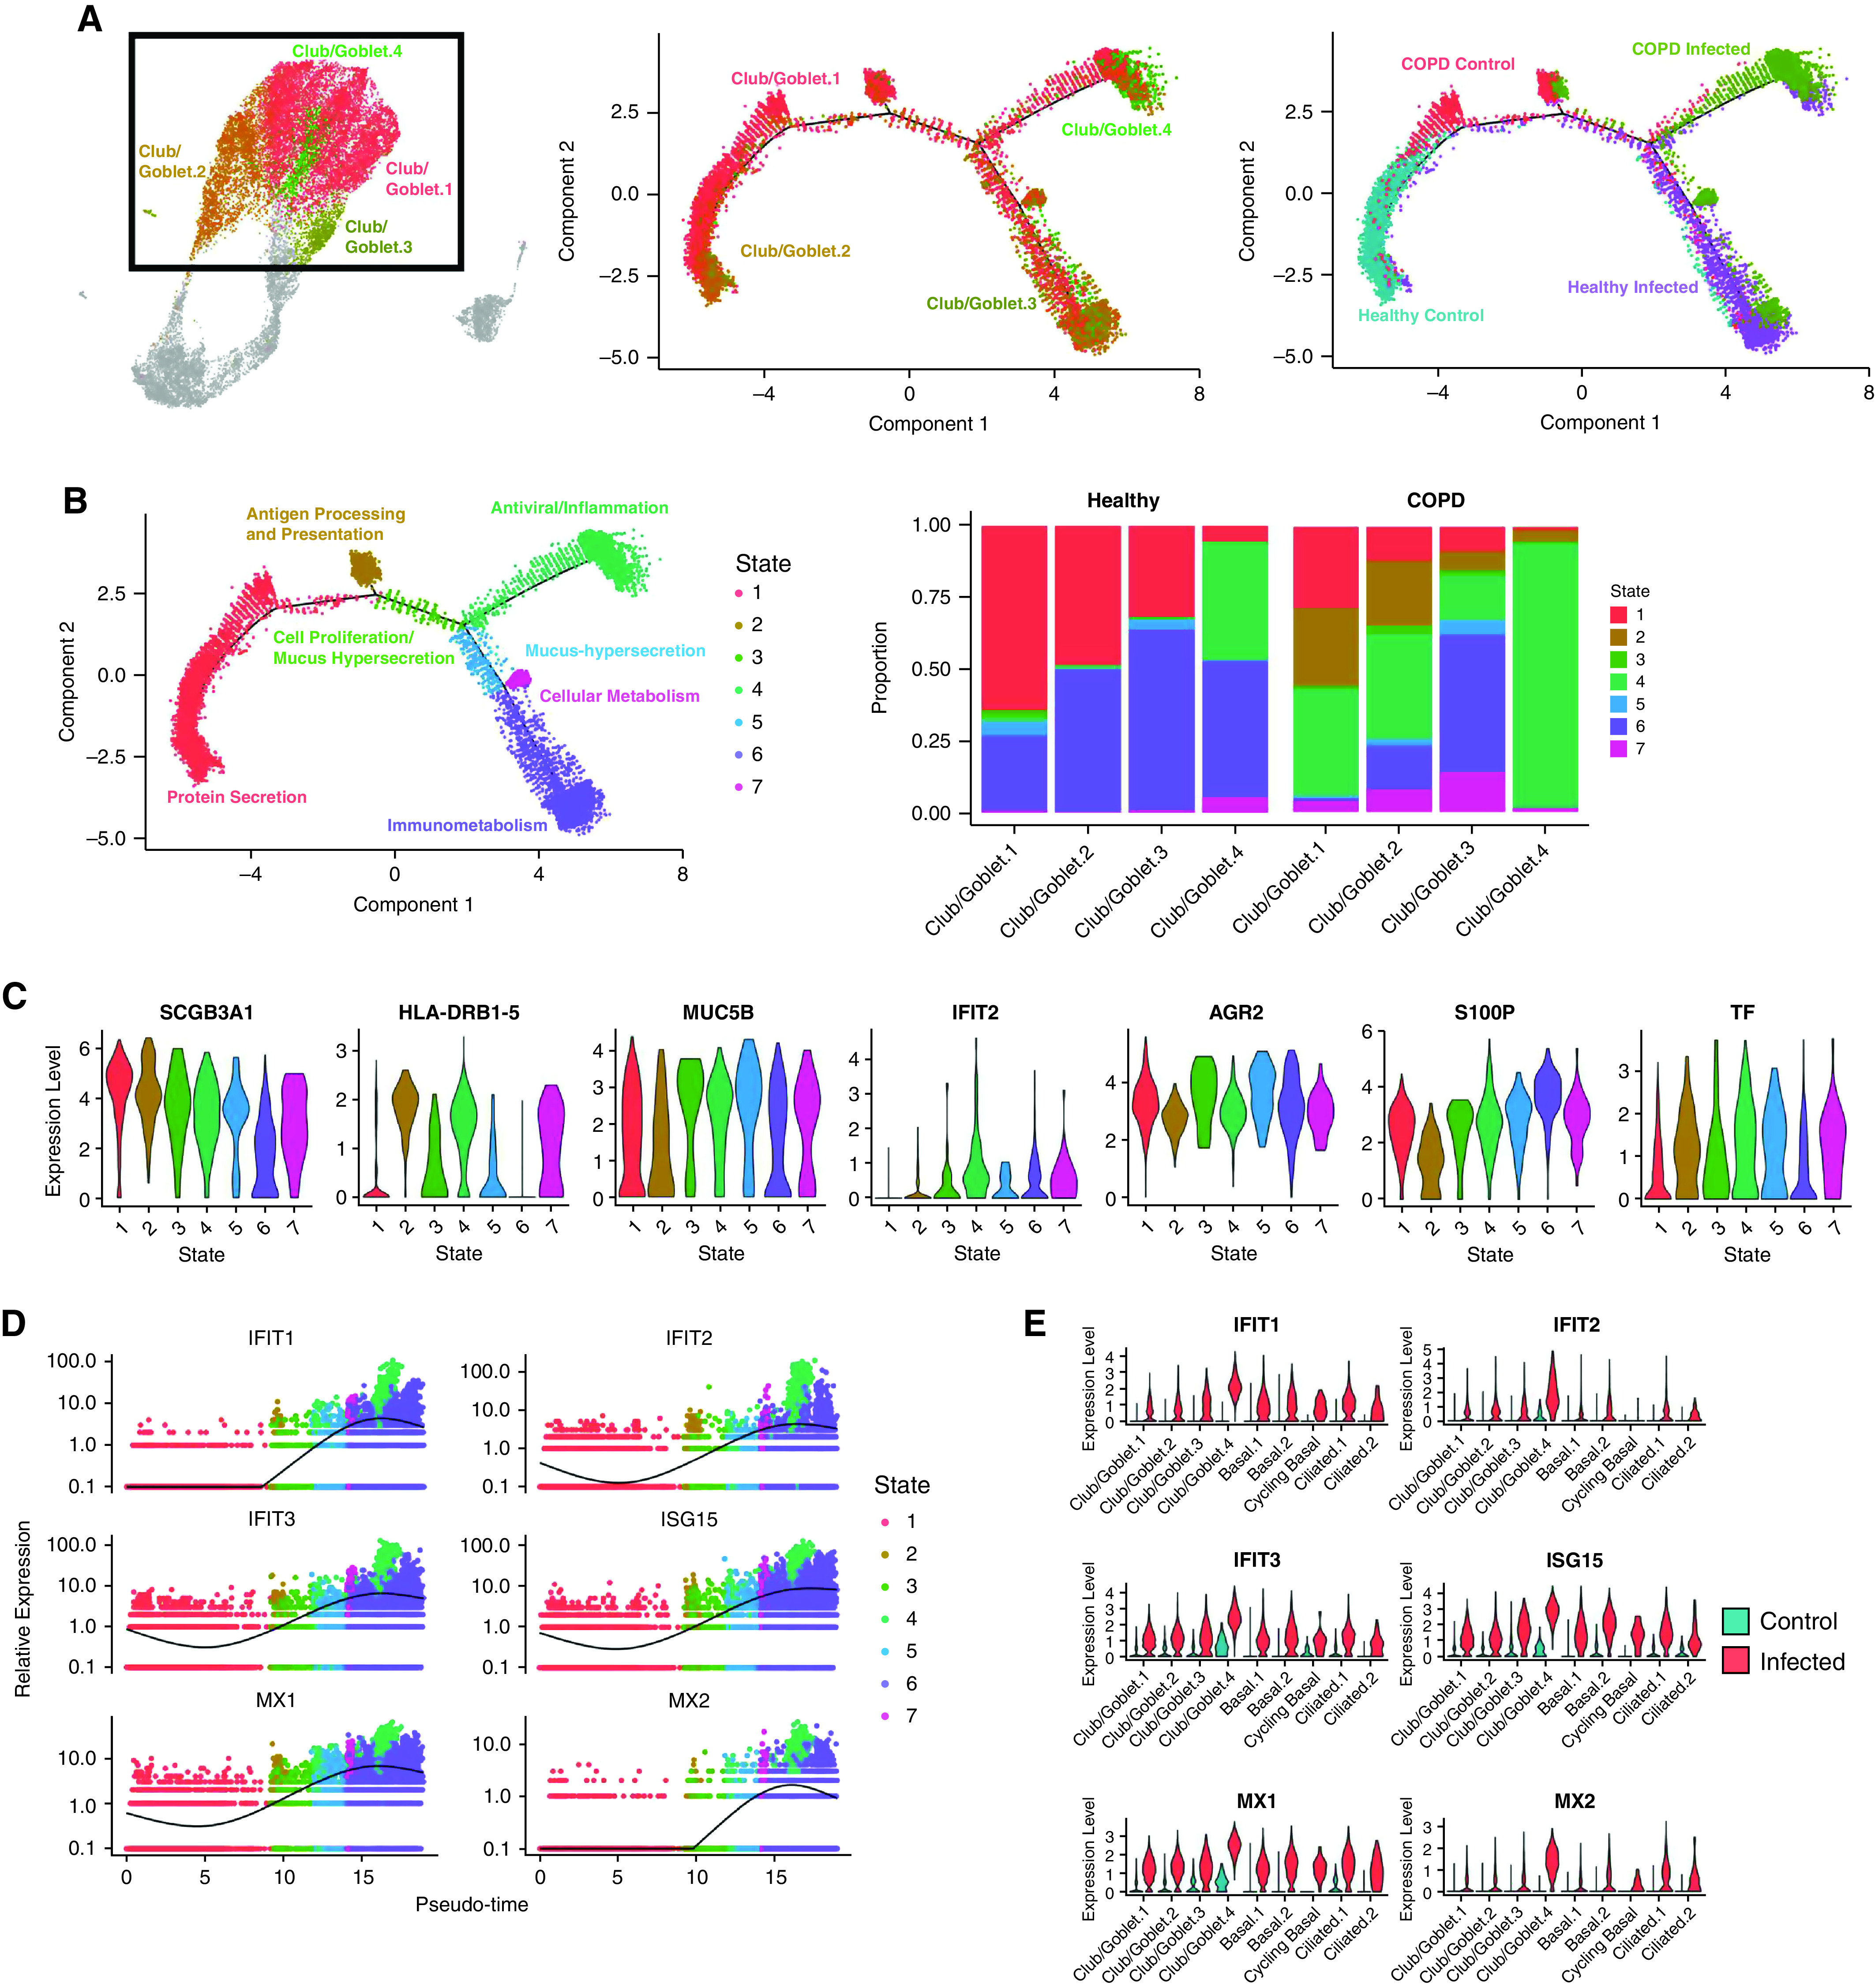
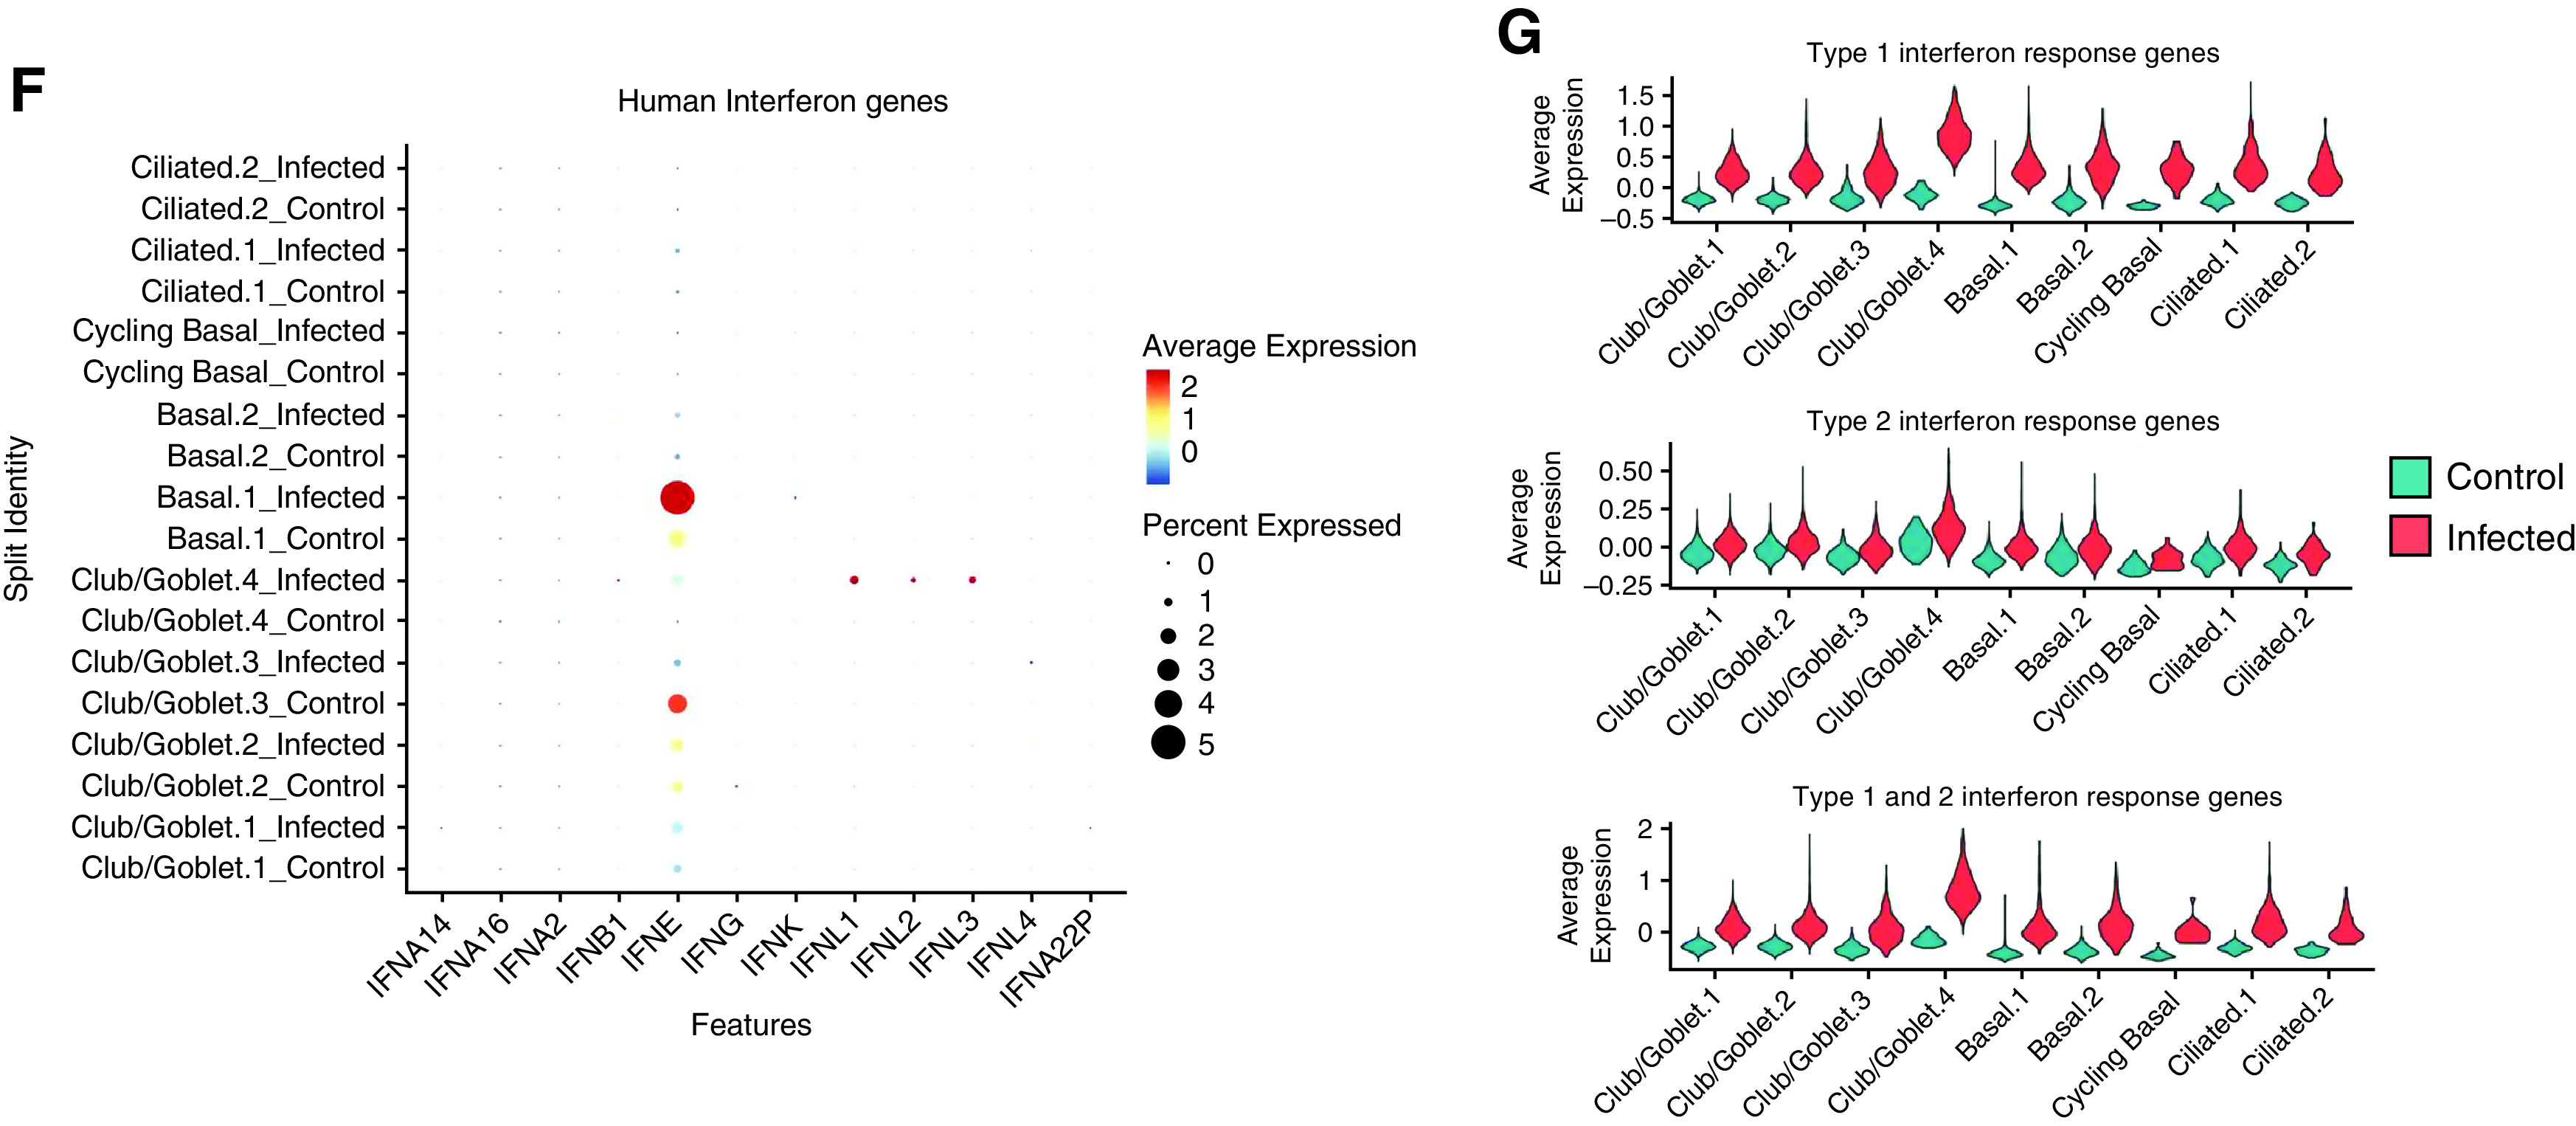
Emergence of the Club/Goblet.4 cluster is driven by severe acute respiratory syndrome coronavirus 2 (SARS-CoV-2) infection. (A) Trajectory analysis in club/goblet cells colored by the four identified clusters, samples, and (B) cell states. The proportion of cell states in different cell types is shown in the barplot. (C) Violin plots of differentially expressed genes among cell states. (D) Pseudotime trajectory of IFN response genes (IRGs) colored by cell states. (E) Violin plots of IRGs in control and infected cells. (F) Average expression of human IFN genes. (G) Violin plots of type 1, type 2, and both type 1 and type 2 IRGs. COPD = chronic obstructive pulmonary disease.
