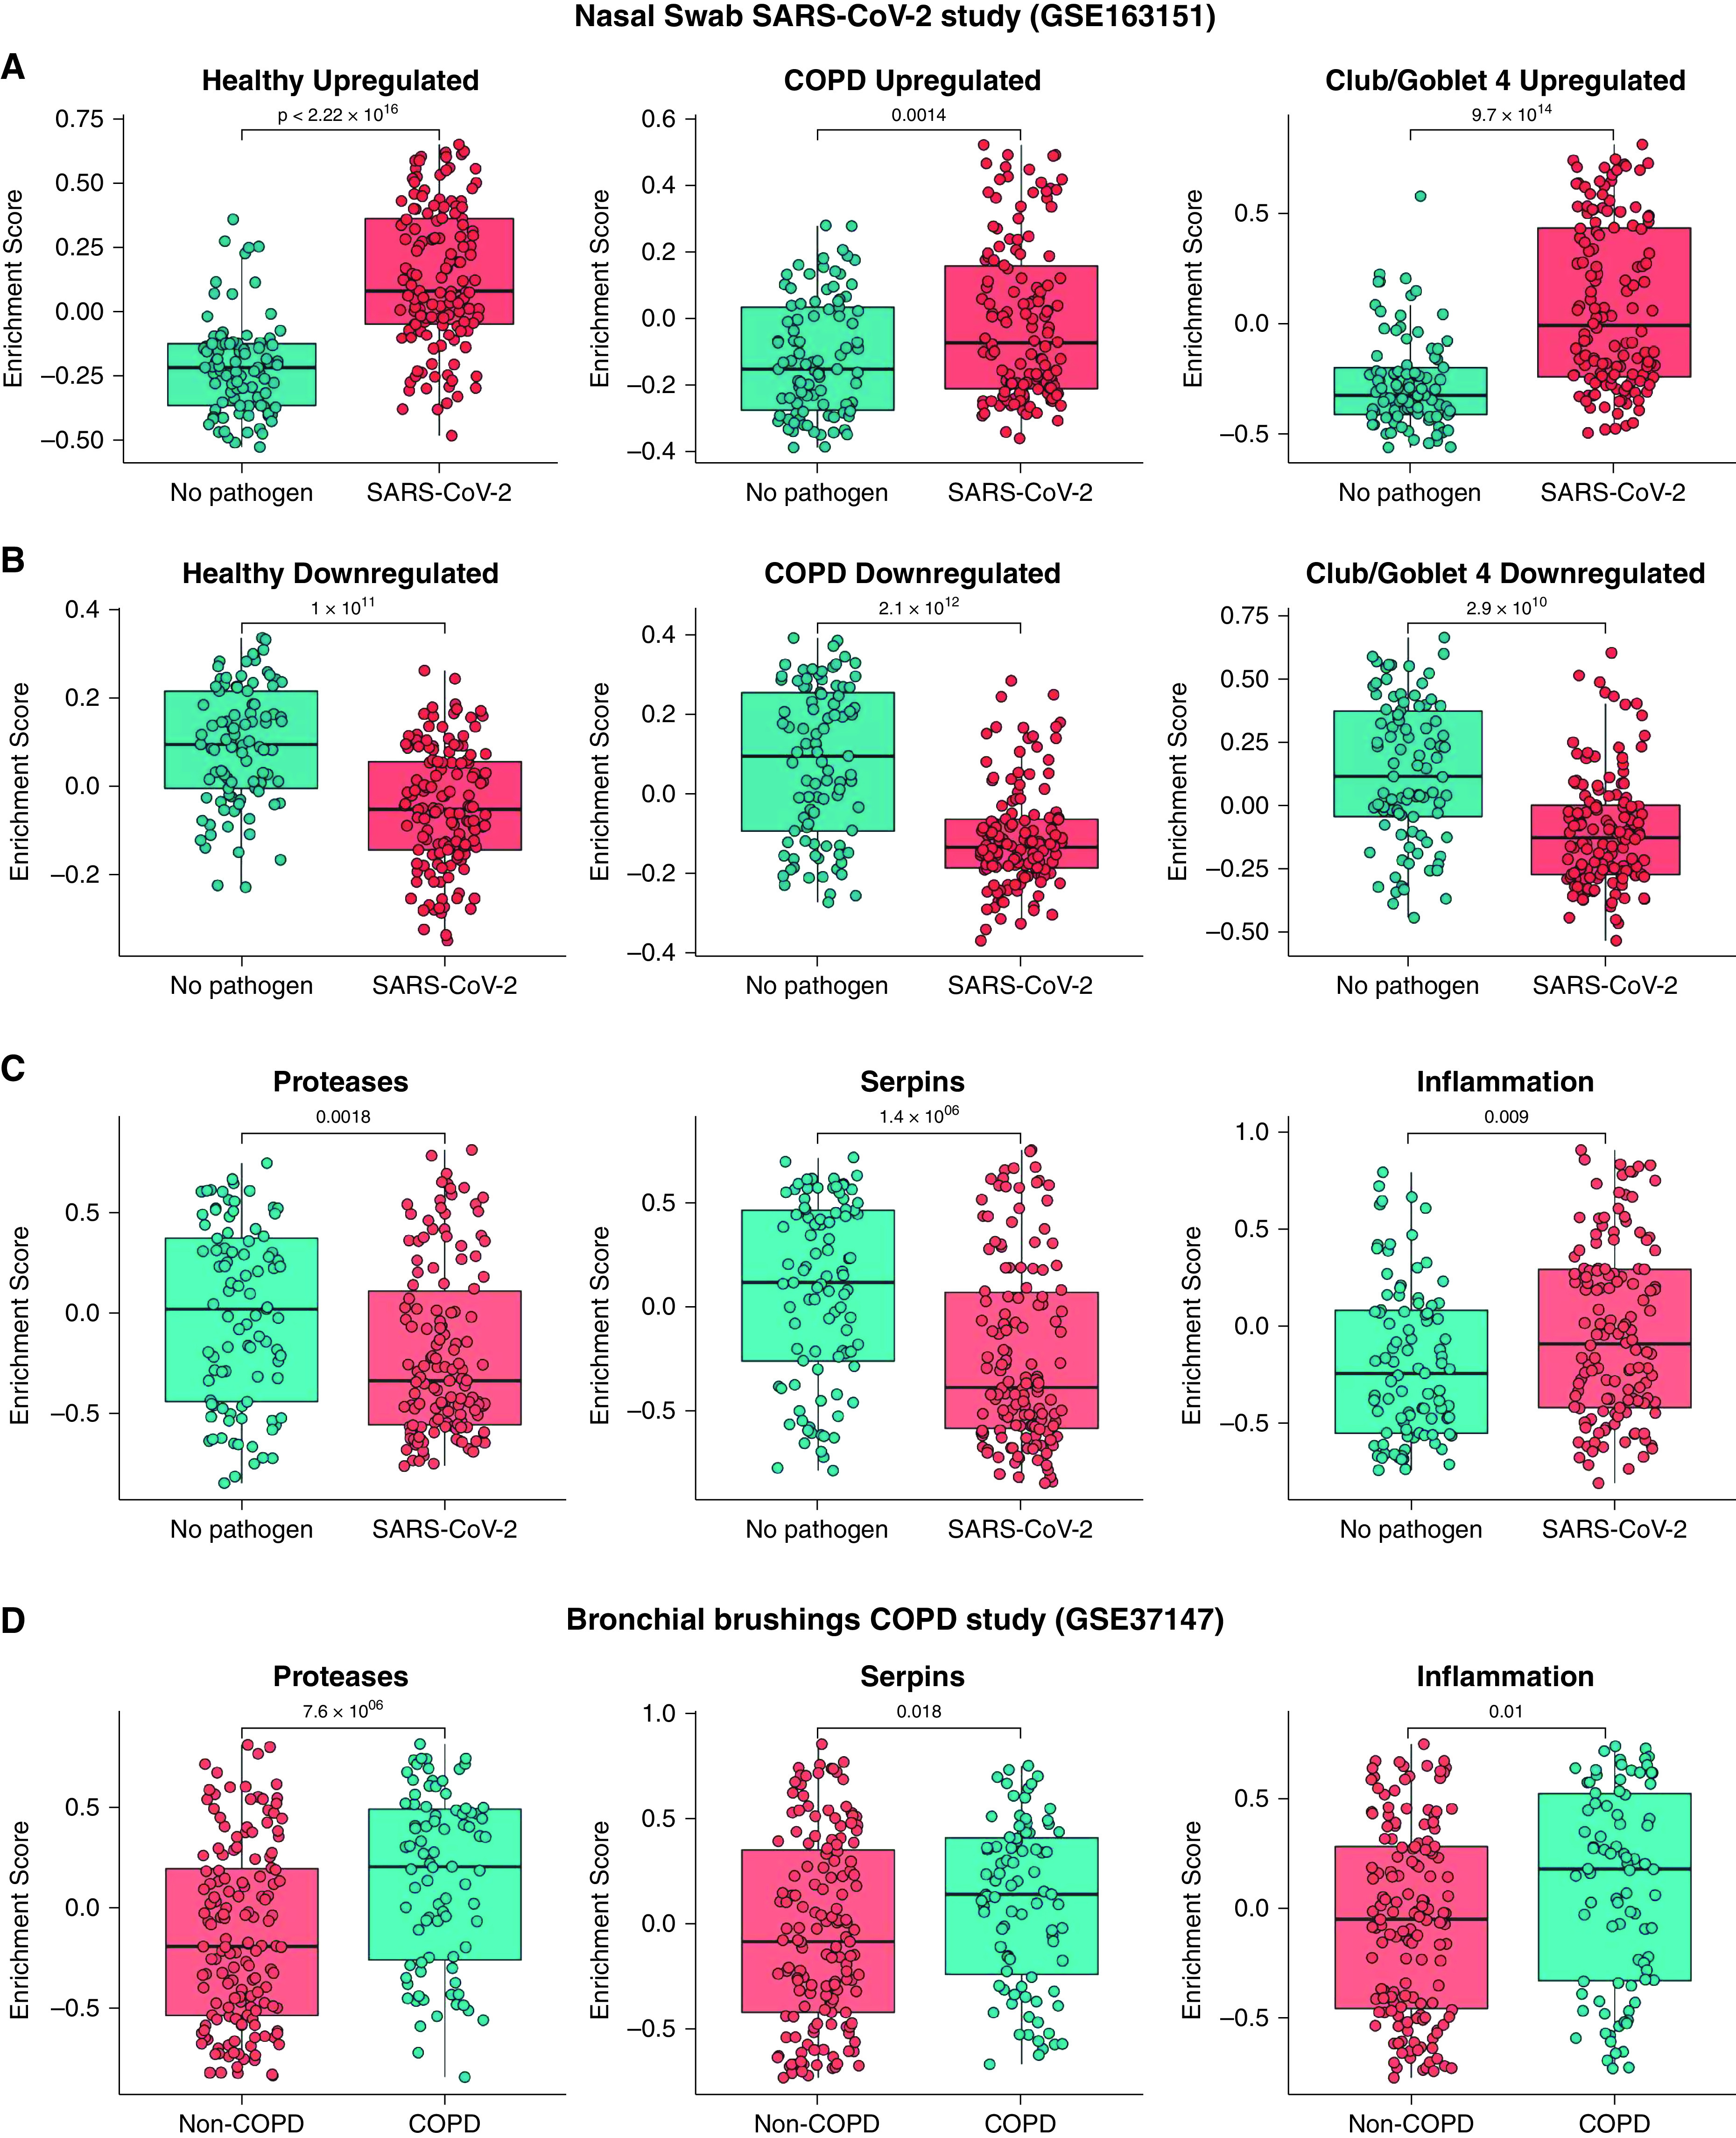
Figure 7.

Comparing ex vivo with publicly available severe acute respiratory syndrome coronavirus 2 (SARS-CoV-2) infection in vivo data. Gene set variation analysis (GSVA) was performed with bulk RNA sequencing dataset of in vivo SARS-CoV-2 nasal swabs (n = 231, GSE163151). GSVA of (A) up- and (B) downregulated genes in infected healthy and chronic obstructive pulmonary disease (COPD) samples compared with their control cells and Club/Goblet.4 cells compared with other cell types. (C) GSVA was performed for protease, serpin, and inflammatory genes with a nasal swab in vivo data. (D) GSVA of proteases, serpin, and inflammatory genes with bronchial brushing in vivo COPD data (n = 238, GSE37147). Statistical differences between the groups were accepted at P ⩽ 0.05.
