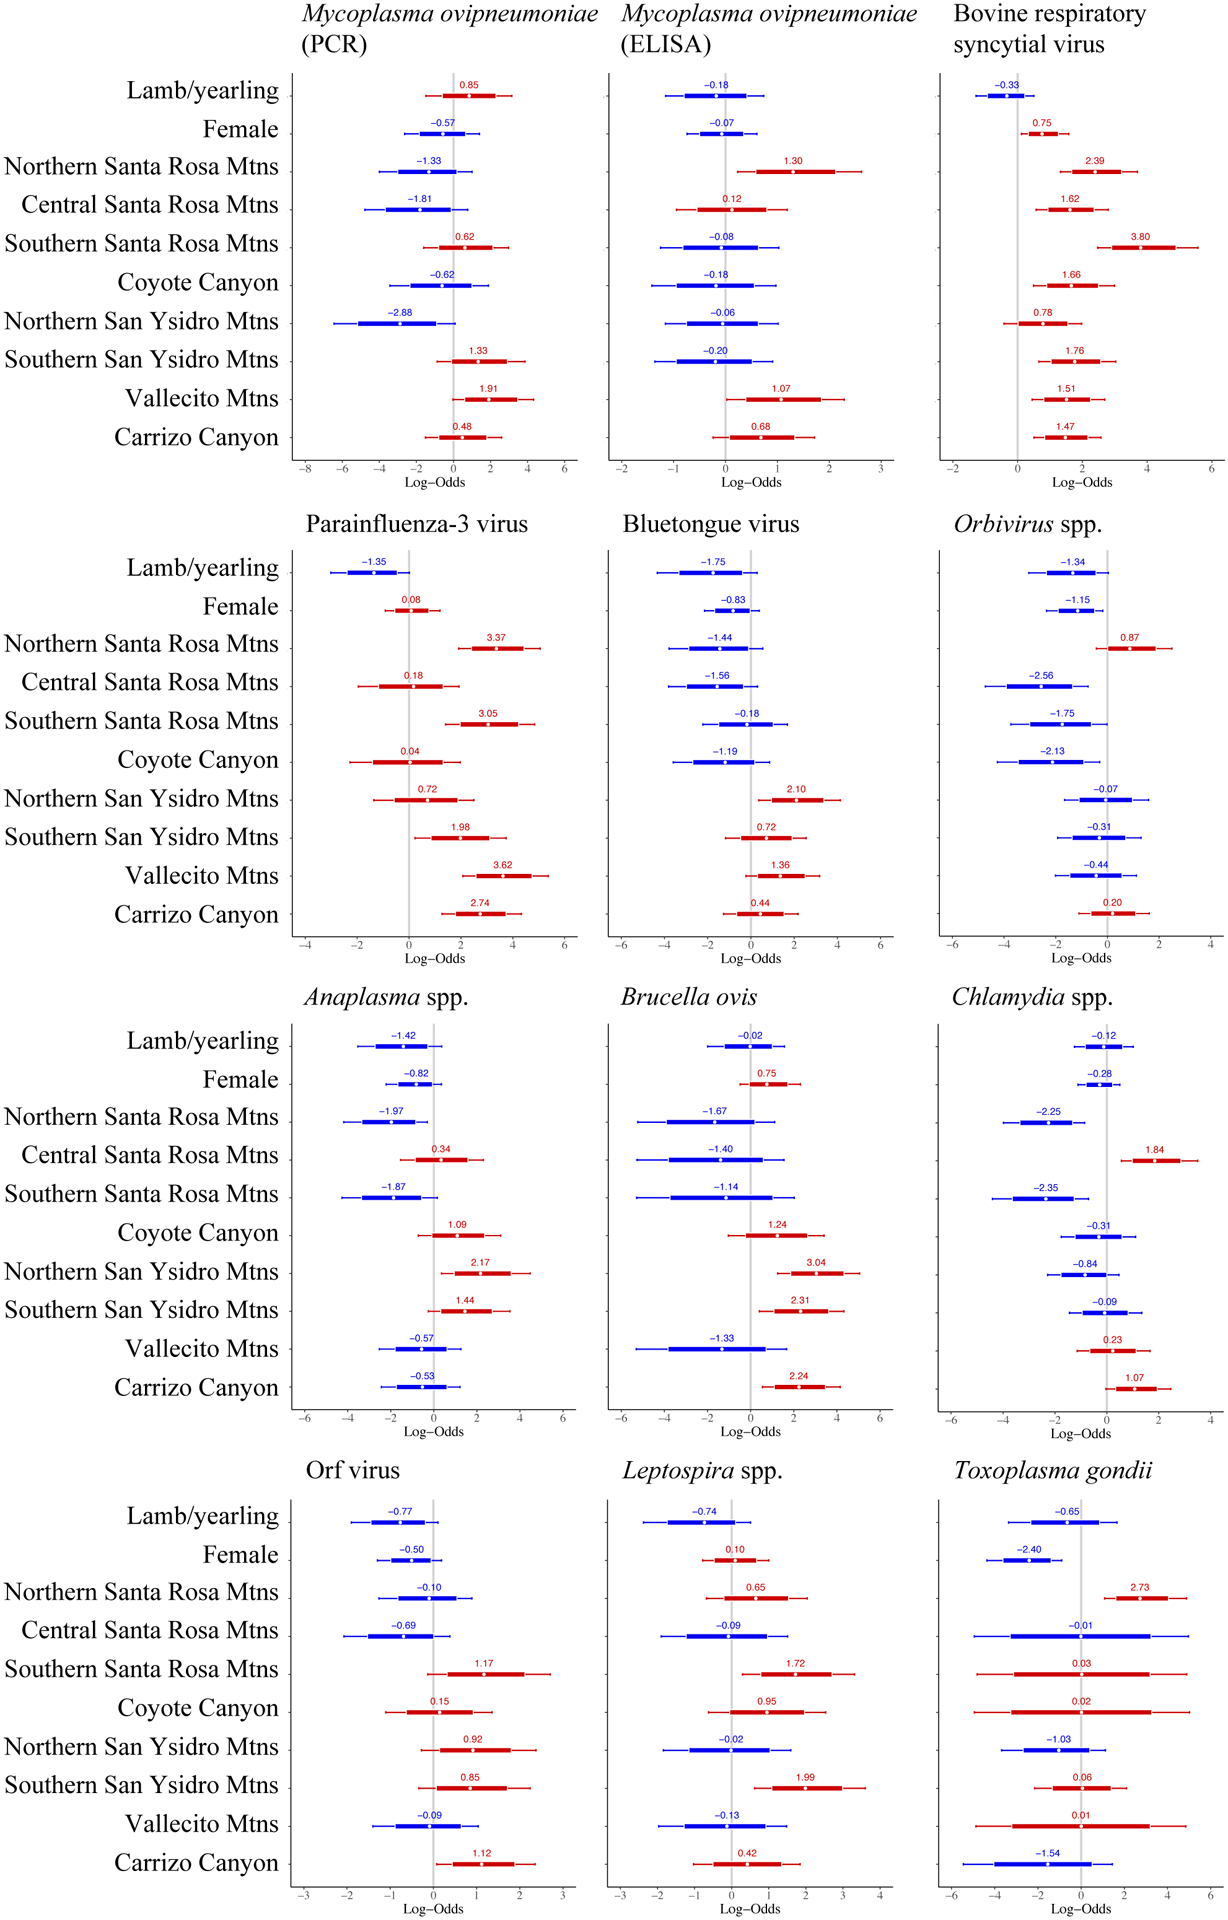
Figure 2.

Forest plots demonstrating the relationship between pathogen status (positive, negative) and Peninsular bighorn sheep age class (lamb/yearling, adult), sex (female, male), and recovery region (categorical, n = 9). Reference categories were adults (for age), males (for sex), and the San Jacinto Mountains (for recovery region). Numbers and white circle represent the log odds of testing positive for a pathogen, relative to a reference category, using Bayesian, multilevel, logistic regression models. Log odds <0 (blue) indicate a lower risk of testing positive for a given pathogen, and log odds >0 (red) indicate a higher risk of testing positive for a given pathogen, relative to the reference category. Thick bars represent the 80% credible interval, and thin bars represented the 95% credible interval. A covariate was a significant predictor of pathogen status if the 95% credible interval did not cross 0.
