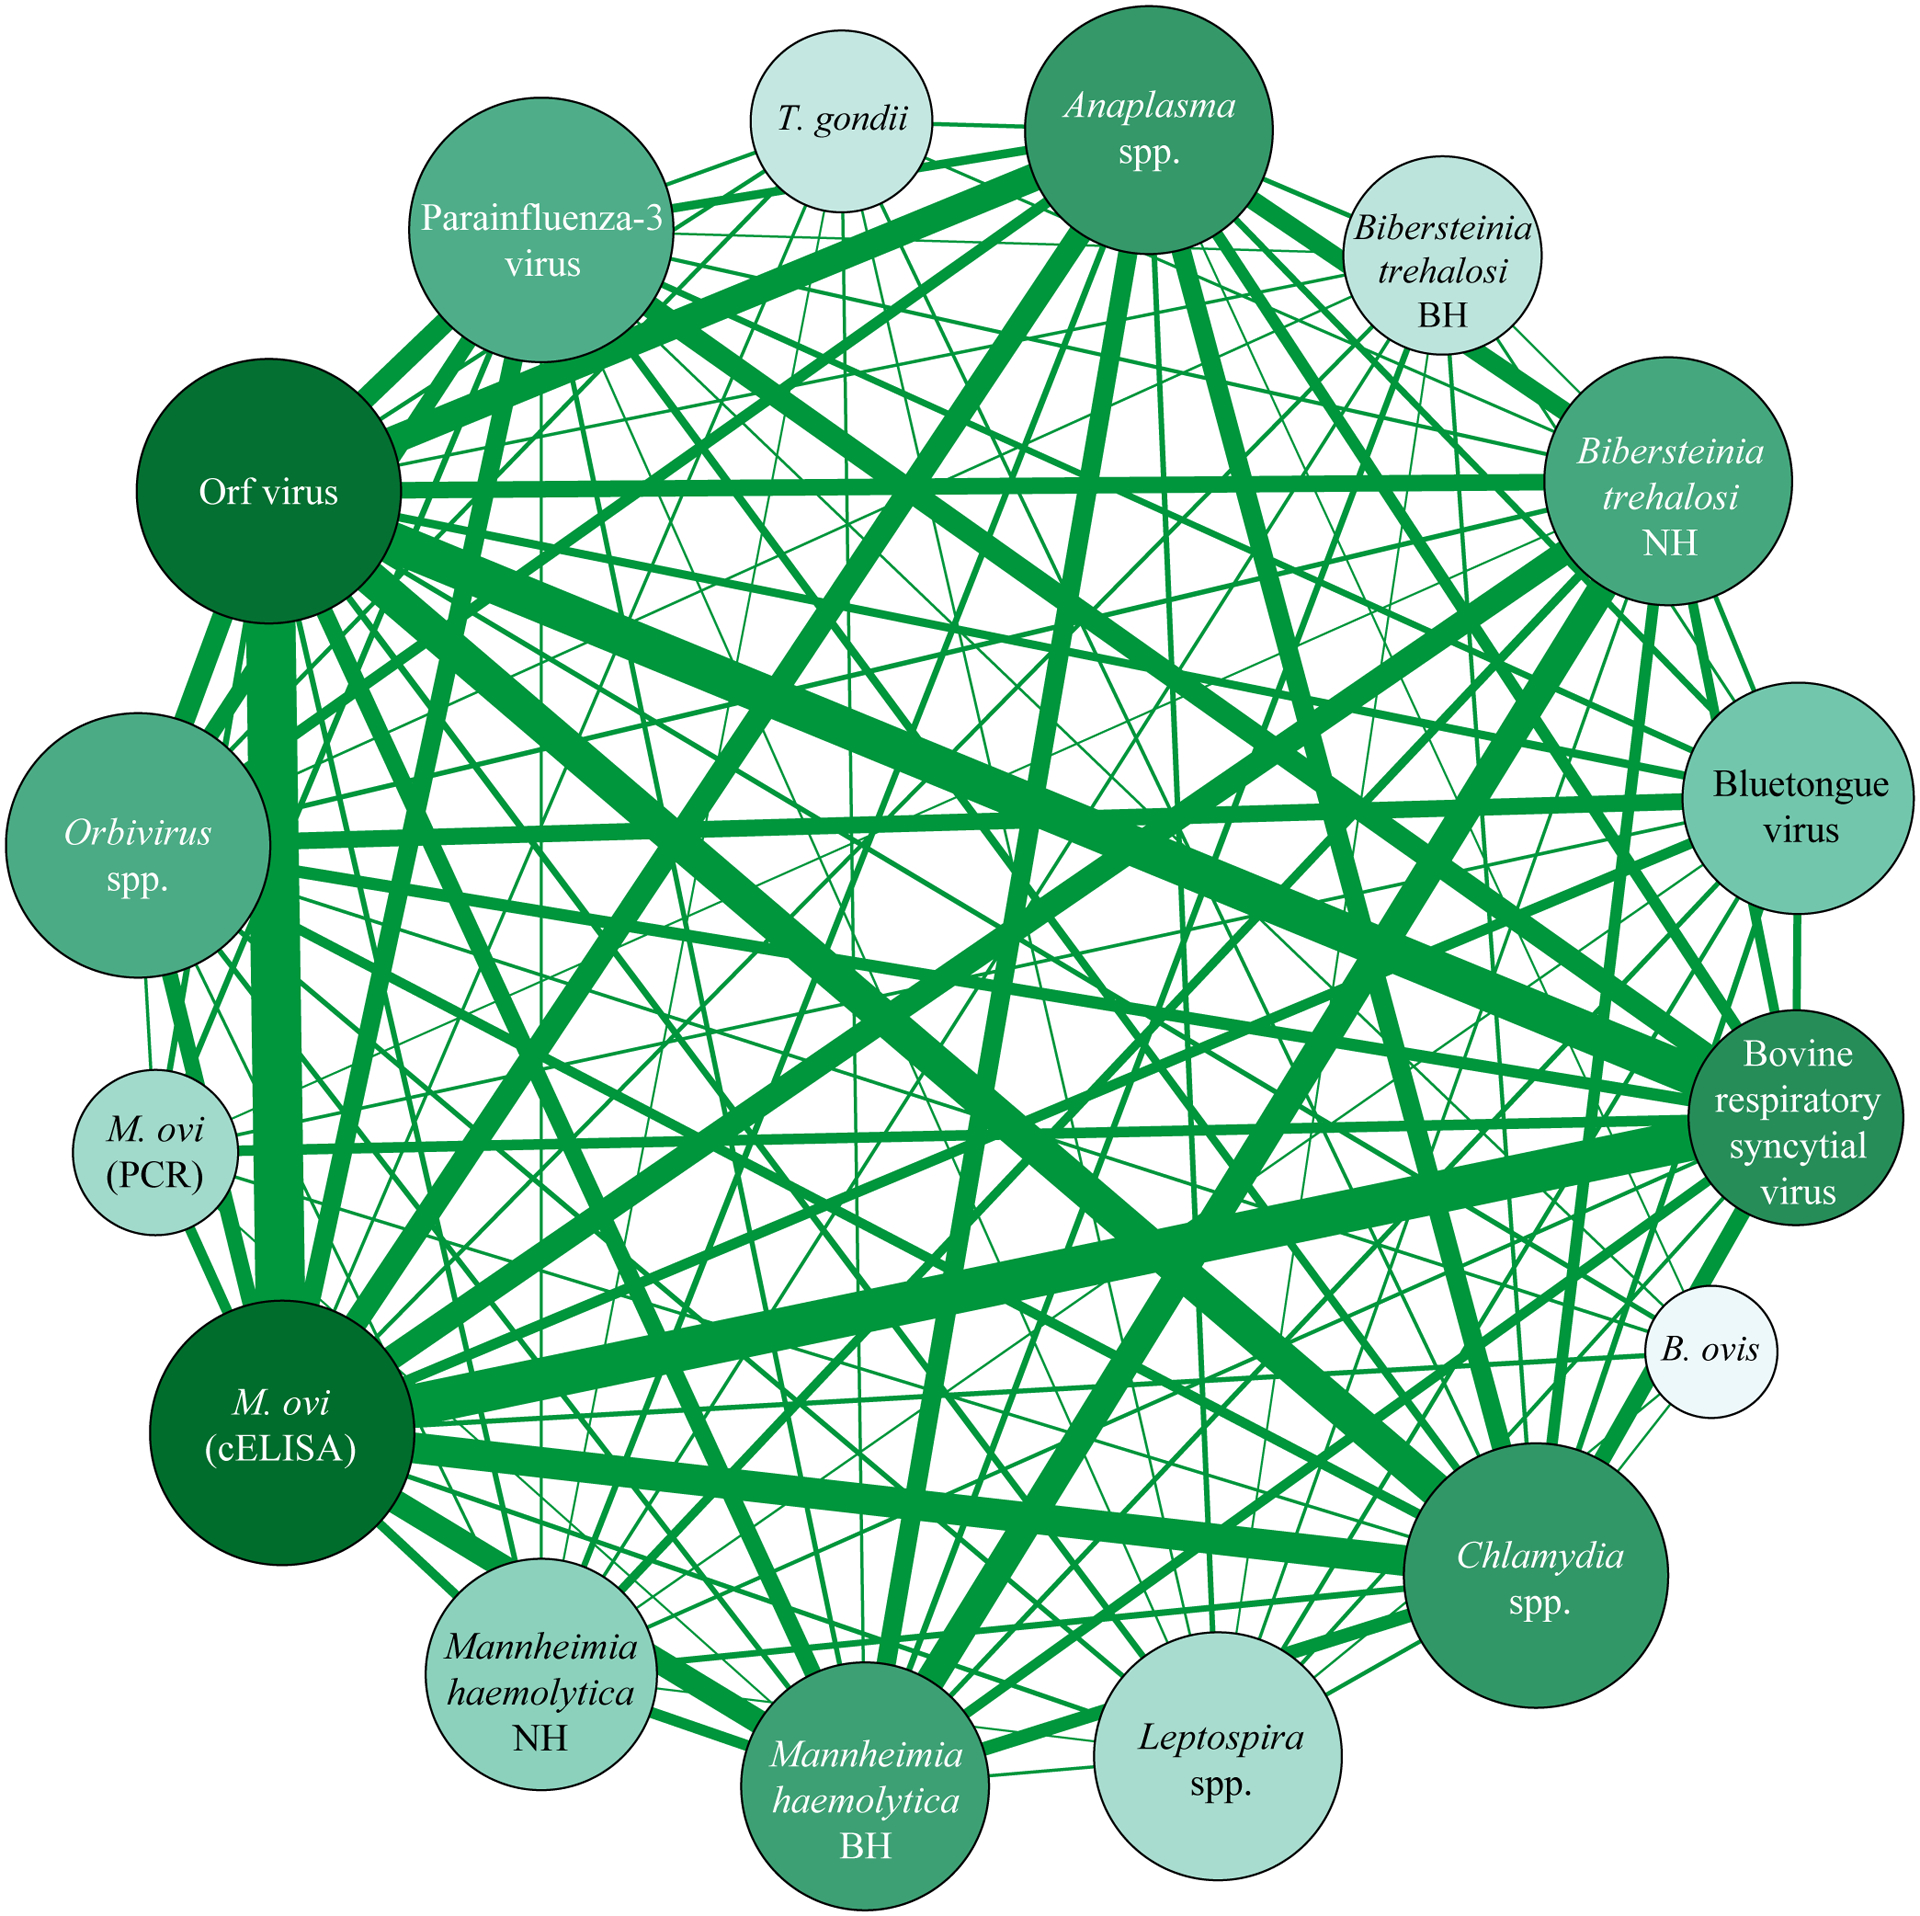
Figure 3.

A weighted, undirected network of pathogens that co-occurred together within an individual bighorn sheep. Size of nodes (circles) is relative to the number of other pathogens that node is connected too (larger nodes are linked to more pathogens; range 7 – 15). Width of edges (lines) between nodes is relative to the proportion of bighorn sheep samples which were positive for a pair of pathogens, given that both pathogens were tested for. The color shade of the nodes corresponds to the weighted degree, calculated as the sum of the edges leading into a node, so that darker nodes are linked to a larger number of other nodes and also tested positive in a larger proportion of samples. B. ovis = Brucella ovis, M. ovi = Mycoplasma ovipneumoniae, T. gondii = Toxoplasma gondii, cELISA = competitive enzyme-linked immunosorbent assay, PCR = polymerase chain reaction, BH = beta-hemolytic, NH = non-hemolytic.
