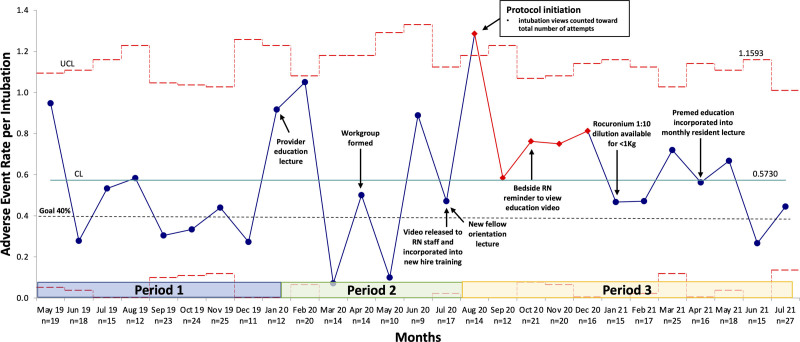
Fig. 4.
Overall adverse event rate per intubation event U-chart. This figure displays the cumulative number of overall AEs (nonsevere, severe, and rare) as the numerator over a denominator of total intubation events per month. Each discrete intubation event could have up to 18 overall AEs (7 nonsevere AEs, 6 severe AEs, and 5 rare AEs). Therefore, the cumulative number of reported AEs might exceed the total number of intubation events per month.

