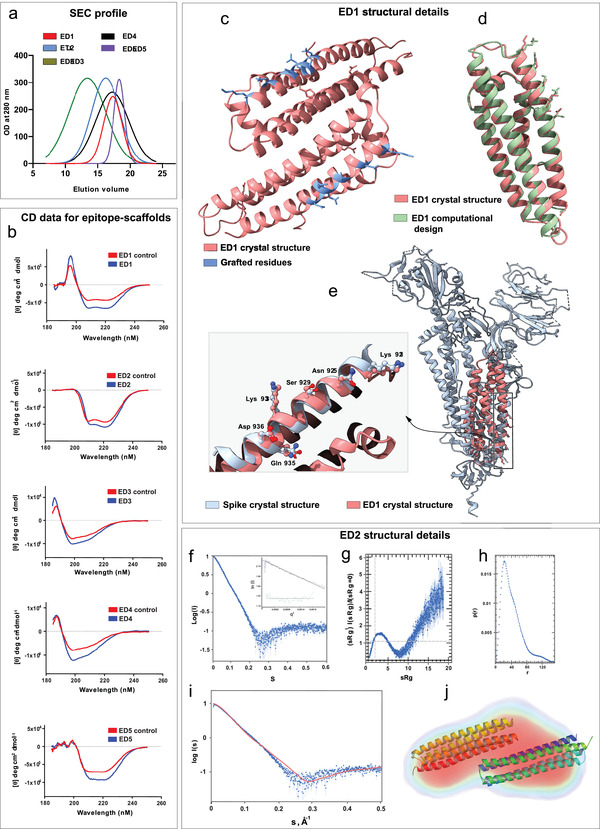
Figure 3.

Structural characterization of designed epitope‐scaffolds. a) Analytical SEC profile for the five epitope‐scaffolds. Of the five designs, four folded into monomers and ED2 formed a dimer in solution. b) The CD spectra of five epitope‐scaffolds compared to native scaffolds (controls). CD data indicated that the expected secondary structures were retained in solution for all designs. c) Crystal structure of ED1, with the grafted residues shown in blue. d) Crystal structure of ED1 aligned to the computational design model. ED1 is shown in salmon color and the design model is shown in green. Epitopes are shown as sticks. e) Crystal structure of ED1 aligned to the corresponding epitope region on spike protein. The enlarged image shows the close‐up view of the alignment between grafted residues in ED1 (salmon) and the corresponding spike epitope residues (blue). Epitopes are shown as ball and sticks. f) SAXS raw data for ED2 at 0.7 mg mL−1 in 20 mm Tris‐HCl at pH7.4 and 500 mm NaCl. Inset shows the Guinier Plot for the ED2 data. g) Kratky plots derived from the SAXS data to qualitatively assess the flexibility and/or degree of unfolding in protein. The results indicate a well folded protein. h) Pair distance distribution function (p(r)) analysis of ED2. P(r) analysis suggests dimeric ED2 in solution. i) The CRYSOL program was used to the calculate SAXS profile of the dimer (red) on the experimental SAXS profile (in blue) (Chi‐square fit of 6.8). j) The DENsity from Solution Scattering (DENSS) electron density map shown as a transparent surface fits a dimer of ED2. The dimer was generated by the SASREF refinement program and energy minimized using the YASARA server.
