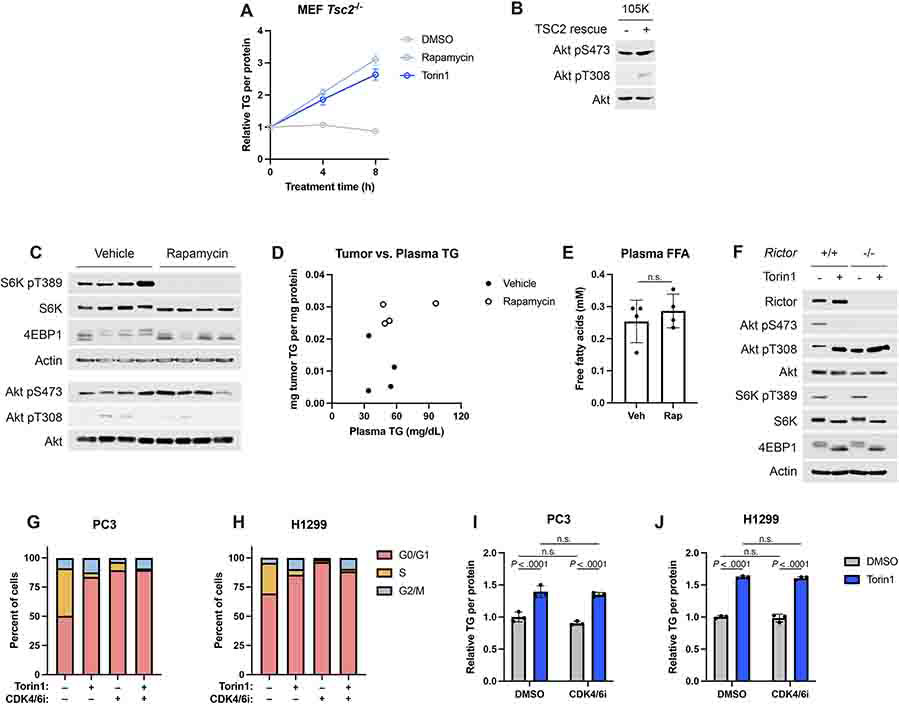
Extended Data Fig. 2.
(A) Triglyceride accumulation measured by enzyme assay and normalized to protein content from the same sample in Tsc2−/− MEFs serum starved for 16 hrs, followed by 0-8 hrs of vehicle, rapamycin (20 nM), or torin1 (250 nM) treatment, graphed as mean ± SD relative to the 0 hr timepoint, n=3.
(B) Immunoblot for AKT and pAKT corresponding to Figure 2M.
(C) Immunoblot for the tumors shown in Figure 2O.
(D) Tumor TG versus plasma TG for individual mice shown in Figures 2O,P.
(E) Plasma non-esterified fatty acids (NEFA) measured for the mice shown in Figure 2O, graphed as mean ± SD, n=5 mice.
(F) Immunoblot corresponding to the experiment shown in Figure 2Q.
(G,H) Cell cycle profile for PC3 (G) and H1299 (H) cells treated for 16 hrs with vehicle, palbociclib (CDK4/6i, 100 nM), and/or torin1 (250 nM), n=1.
(I,J) Triglyceride levels quantified by enzyme assay and normalized to protein content from the same sample for cells treated as in (G,H), graphed as mean ± SD relative to vehicle-treated cells, n=3.
Statistical analysis by two-way ANOVA (I,J) and two-tailed Student’s t-test (E); n.s., not significant.

