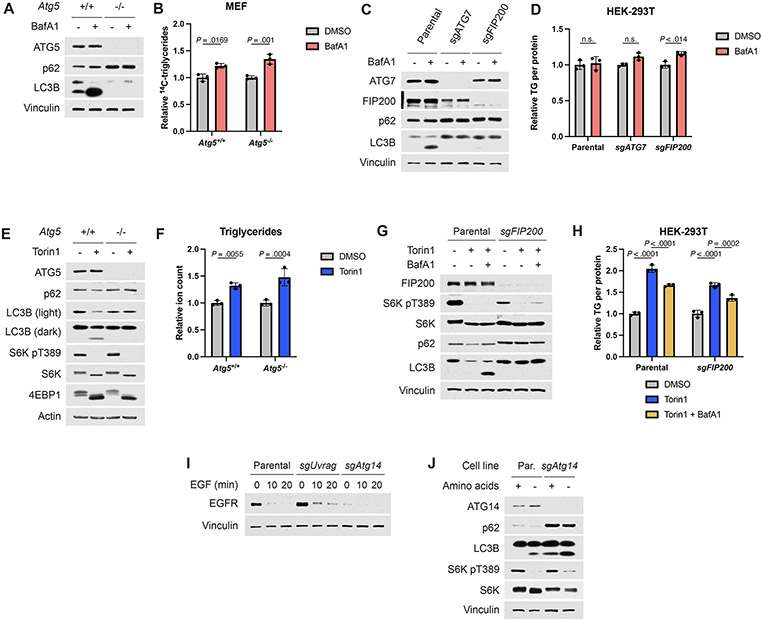
Extended Data Fig. 7.
(A,B) Immunoblot (A) and TGs measured by pulse-chase with [1-14C]-oleate tracer (B) in Atg5+/+ and −/− MEFs treated for 16 hrs with vehicle or BafA1 (250 nM), graphed as mean ± SD relative to vehicle-treated cells, n=3.
(C,D) Immunoblot (C) and triglyceride levels measured by enzyme assay (D) and normalized to protein content from the same sample for parental, ATG7 knockout, and FIP200 knockout HEK-293T cells treated with vehicle or bafilomycin A1 (250 nM) for 16 hrs, graphed as mean ± SD relative to vehicle-treated cells, n=3.
(E,F) Immunoblot (E) and triglyceride levels (F) corresponding to the results shown in Figures 6E,F. Triglyceride levels are graphed as mean ± SD relative to vehicle-treated cells, n=3.
(G,H) Immunoblot (G) and triglyceride levels measured by enzyme assay (H) and normalized to protein content from the same sample for parental and FIP200 knockout HEK-293T cells treated with vehicle, torin1 (250 nM), and/or bafilomycin A1 (250 nM) for 16 hrs, graphed as mean ± SD relative to vehicle-treated cells, n=3.
(I) EGFR degradation assay in parental Tsc2−/− MEFs and sgUvrag or sgAtg14 clones. Cells were serum starved for 16 hrs and stimulated with EGF (10 ng/mL) for the indicated times.
(J) Immunoblot for autophagy markers in parental Tsc2−/− MEFs and sgAtg14 clone after 4 hrs in amino acid replete or free medium.
Statistical analysis by two-way ANOVA (B,D,F,H). n.s., not significant.

