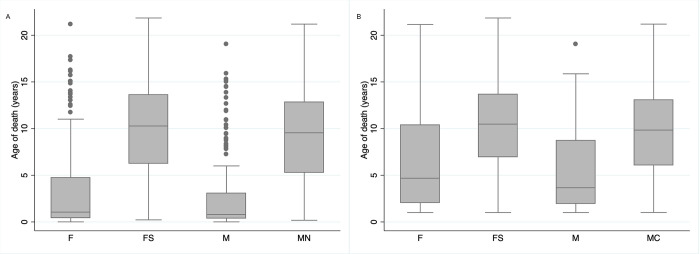
Fig 2. Spay and neuter status affects longevity in cats.
(A) Box plot showing age at time of death for all cats where age was known categorized by sex. (B) Box plot showing age at time of death for all cats ≥ 1 year where age was known categorized by sex. F = Intact Female, FS = Female spayed, M = Intact male and MN = male neutered.

