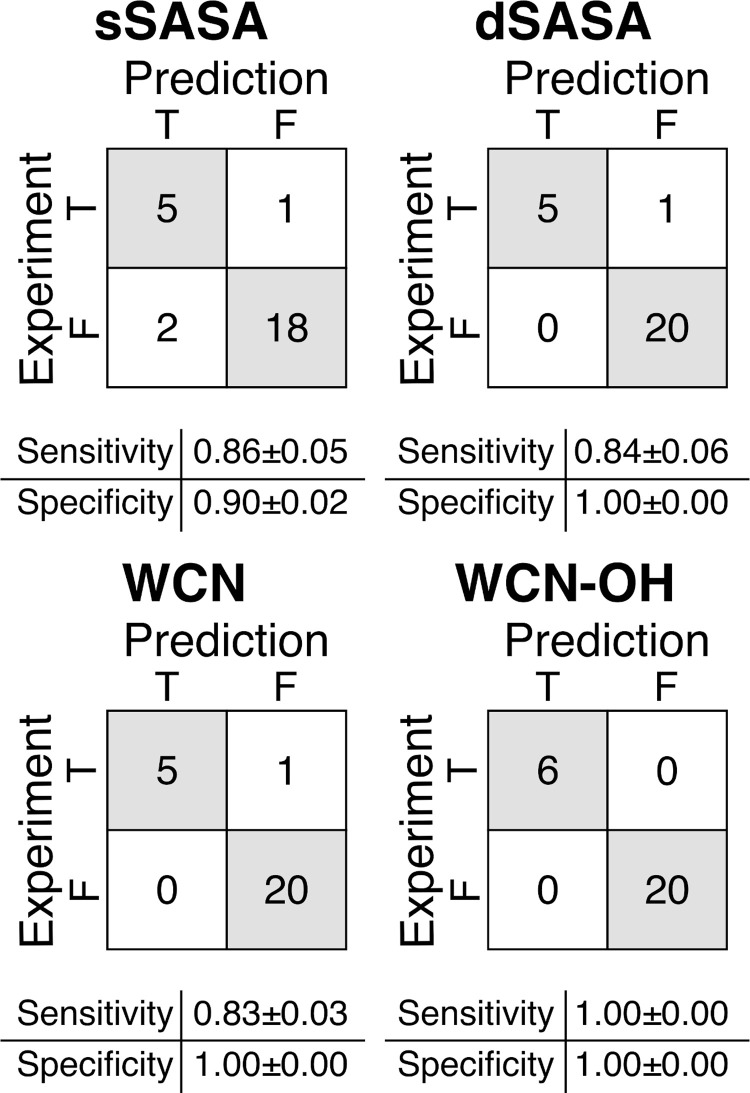
Fig 5. Confusion matrices for the in silico prediction of the oxidation events of the 7 mAbs and 2 ADCs.
Confusion matrices reports TP, FN on the first row and FP, TN on the second row. Sensitivity calculated as TP/(TP+FN); Specificity calculated as TN/(TN+FP). TP = True Positive, TN = True Negative, FP = False Positive, FN = False Negative. Error for the sensitivity and specificity were estimated from 50 bootstrap replicates.

