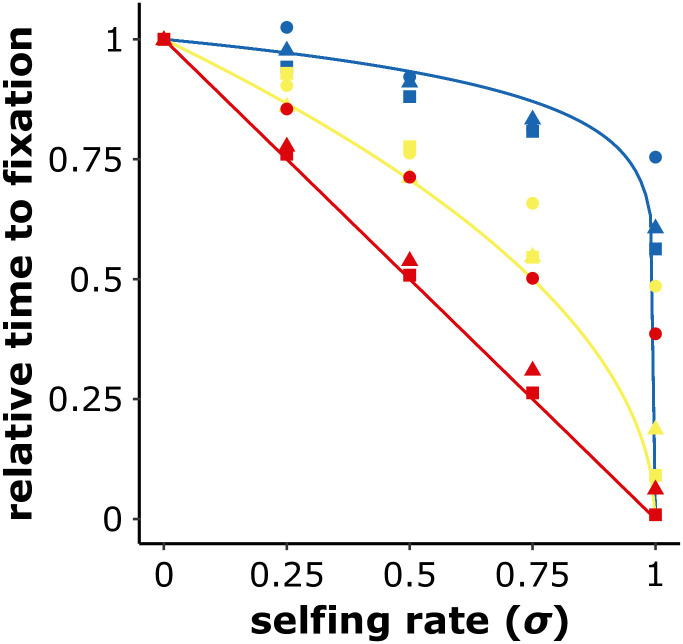
Fig 2. Underdominant mutations accumulate more rapidly in selfing populations.
Analytical predictions (lines) and outcomes of multi-locus simulations (symbols) of the averaged number of generations required to fixate an underdominant mutation compared to an outcrossing population (σ = 0). 4Nsu follows a Gamma distribution with a shape parameter β of 0.1 (blue), 0.5 (yellow), or 1 (red), and mean parameter γ of 10 (circles), 100 (triangles), or 1,000 (squares). L = 100, N = 1, 000, μ = 10−6, r = 0.01. The analytical predictions are (1 − σ)β. 1, 000 iterations.

