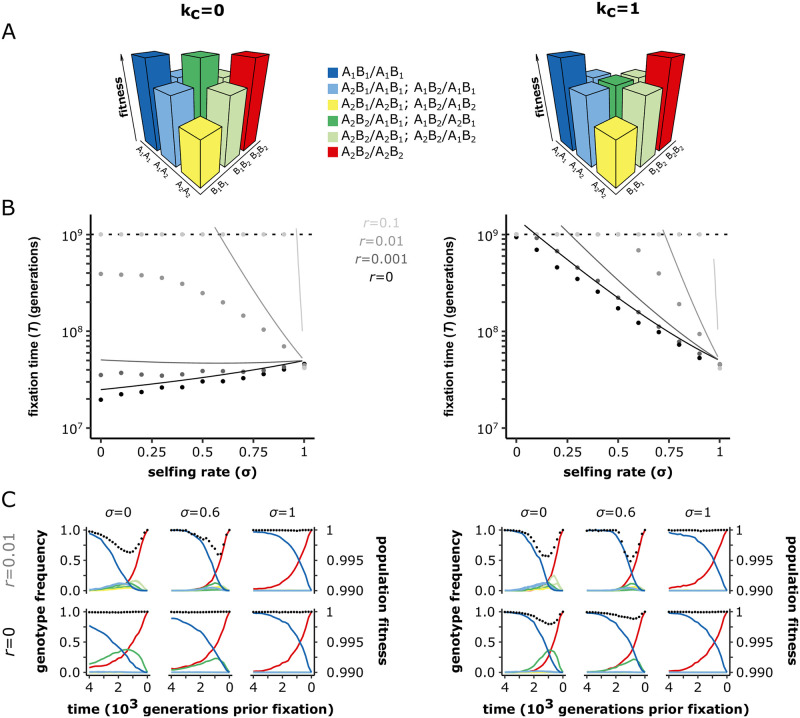
Fig 3. The effect of selfing on the fixation of compensatory mutations depends on the dominance coefficient in the double heterozygote (kc), and the recombination rate(r).
(A) Schematic representations of the fitness landscapes for compensatory mutations with kc = 0 (left) or kc = 1 (right). A1 and B1 are the ancestral alleles. A2 and B2 are the derived alleles. (B) Time to fixation of a pair compensatory mutations with kc = 0 (left) or kc = 1 (right). The lines correspond to the analytical approximations (Eq 14) for r = 0 (black), r = 0.001 (dark grey), r = 0.01 (grey) and r = 0.1 (light grey). Dots show the corrected mean times to fixation of a pair of compensatory mutations from our two-locus simulations. We corrected the raw means because the threshold made our data right censored (i.e., missing estimates above 109 generations), which we accounted for by first estimating the full distribution by fitting gamma distributions on our simulation outputs using the fitdistriplus R package [55], from which we estimated the corrected mean times to fixation. The dashed horizontal lines indicate the generation threshold after which simulations stop. N = 1, 000, μ = 10−5, hc = 0.5, sc = 0.01. 1, 000 iterations. (C) Population fitness (black dots—right y axis) and the frequencies of the 10 possible genotypes on the two loci fitness landscapes (solid lines—left y axis) over the last 4200 generations preceding the fixation of the pair of compensatory mutations. The line colours match the genotype colours on the fitness landscapes. N = 1, 000, μ = 10−5, hc = 0.5, sc = 0.01. 100 iterations. See S3 and S4 Figs for the visualisation of additional parameter combinations.

