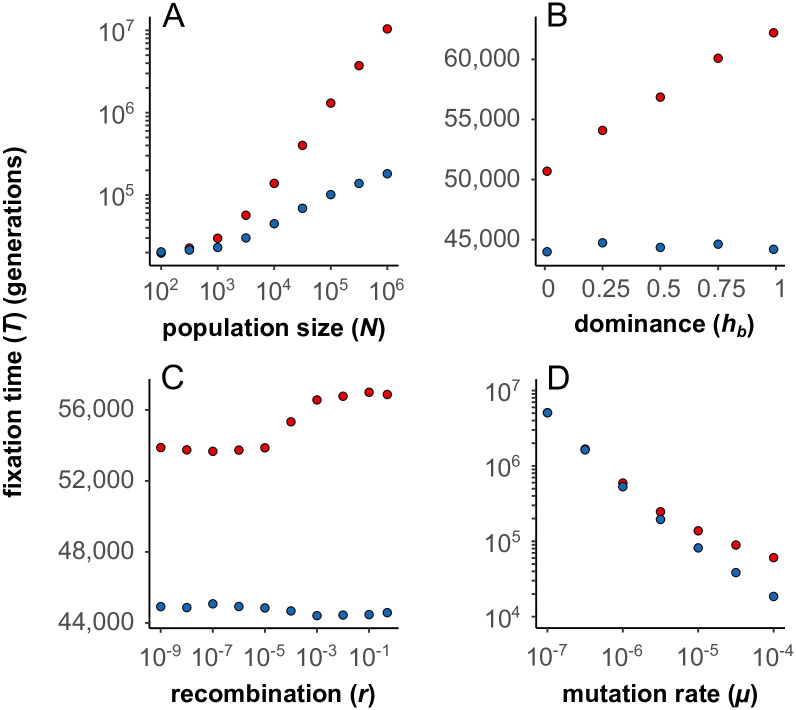
Fig 5. Fixation time of BDMi mutations (red) compared to neutral mutations (blue) in outcrossing populations (σ = 0) (two-locus model).
(A) Higher population sizes (N) decelerate the fixation of BDMi mutations (sB = 2.5.10−2, hB = 0.5; red) compared to neutral mutations (sb = 0; blue). r = 0.5, μ = 2.5.10−5. 1, 000 iterations. (B) Higher coefficients of dominance (hb) decelerate the fixation of BDMi mutations (sb = 2.5.10−4; red) compared to neutral mutations (sb = 0; blue). N = 10, 000, r = 0.5, μ = 2.5.10−5. 10, 000 iterations. (C) Higher rates of recombination (r) decelerate the fixation of BDMi mutations (sb = 2.5.10−4, hb = 0.5; red) compared to neutral mutations (sb = 0; blue). N = 10, 000, μ = 2.5.10−5. 100, 000 iterations. (D) Higher rates of mutation (μ) decelerate the fixation of BDMi mutations (sb = 2.5.10−3, hb = 0.5; red) compared to neutral mutations (sb = 0; blue). N = 10, 000, r = 0.5. 10, 000 iterations.

