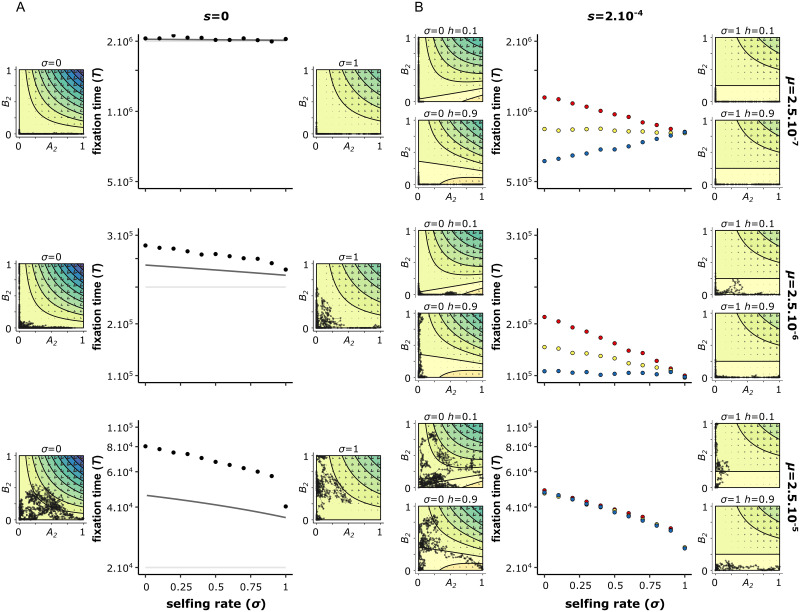
Fig 6. Selfing rate accelerates the fixation of BDMi mutations for high mutation rates.
The fixation time estimated from the two loci models with mutation rates (μ) for A2 and B2 of either 2.5.10−7 (top), 2.5.10−6 (middle), or 2.5.10−5 (bottom), and the strength of selection on the derived alleles (s) is either 0 (left), or 2.10,−4 (right). When there is selection, the dominance coefficient (h) is either recessive (h = 0.1, red), co-dominant (h = 0.5, yellow), or dominant (h = 0.9, blue). The solid lines in the neutral scenario correspond to analytical approximations: 1/2μ (light grey), and Eq (17) (dark grey) (see BDMi Results section for details on the approximations). Each phase portrait shows, for a single simulation, the change in allele frequencies of A2 and B2 plotted from the beginning, and then every 100 generations until the fixation of a derived allele. The isoclines represent the expected benefits (warm colours) and costs (cold colours) on population fitness (multiplied by Ne, and with a increment of 1). The direction of the arrow indicates the expected allele change (which is the balance between mutation rates and selection), and their size indicates the strength of the change. N = 10, 000, hb = kb = 0.5, sb = 10−3, r = 0.5. 10, 000 iterations.

