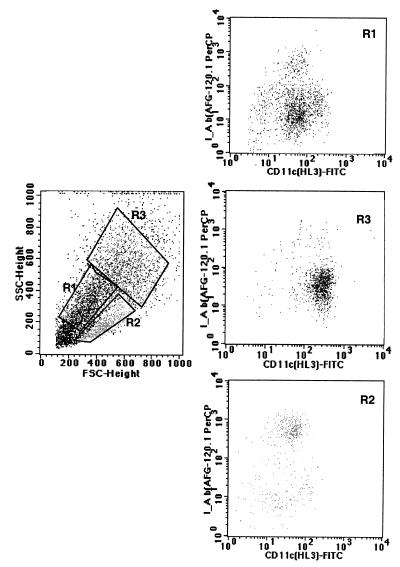
FIG. 2.
Flow cytometric analysis of lung dendritic cells after overnight culture of nonadherent CD11c+ lung cells. Cells were washed and stained with CD11c+ -FITC and I-Ab–biotin plus avidin PerCP. The left panel shows the variable size of the CD11c+ cells. Cells could be gated into three populations as follows: region 1 (R1) with FSClow and SSClow corresponding to small cells; region 2 (R2) with FSCmid and SSClow corresponding to large cells with low granularity; and region 3 (R3) with FSChigh and SSChigh corresponding to larger and more granular cells. The panels on the right side represent the expression of CD11c+-FITC (x axis) and I-Ab–PerCP (y axis). The expression of these antigens on each of the different populations is shown in region 1 (upper dot plot was gated in R1), region 2 (bottom dot plot was gated in R2), and region 3 (middle dot plot was gated in R3). According to their cell surface expression of CD11c and I-Ab antigens, purified lung dendritic cells after overnight culture constitute a mixed population of cells and can be classified in three populations: (R1 population) I-Ab low CD11c+ low expression, FSClow and SSClow; (R2 population) I-Ab high and CD11+ low, FSCmid SSClow; and (R3 population) I-Ab low CD11c+ high, FSChigh and SSChigh.

