Figure 3.
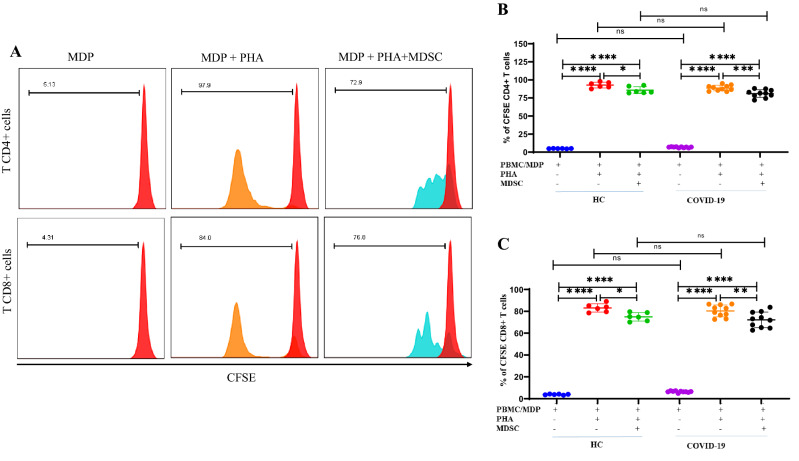
Isolated MDSCs, suppressed CD4 + and CD8 + T cells response in vitro. MDSCs isolated from fresh PBMC of the patients co-cultured with CFSE labeled-autologous MDPs from the patients and CFSE labeled-homologous PBMCs from HCs in the presence of PHA for 5 days. (A) Histograms show representative CD4+ and CD8+ T cell proliferation as assessed by CFSE dilution and flow cytometry. The numbers in the plots indicate the frequency of proliferating T cells. The unstimulated MDPs are indicated in red, PHA-stimulated MDPs are indicated in orange and PHA-stimulated MDPs in presence of MDSCs are indicated in blue. (B,C) Dot plots show the percentage of proliferating CD4+ and CD8+ T cells from 10 COVID-19 patients and 6 HCs. All values are presented as the mean and 5–95% percentile and comparisons made between control and patient groups were performed using ANOVA followed by a Tukey’s test. *P < 0.01, **P < 0.001, ***P < 0.0001 and ****P < 0.0001. Abbreviations: MDP: MDSC depleted PBMC.

