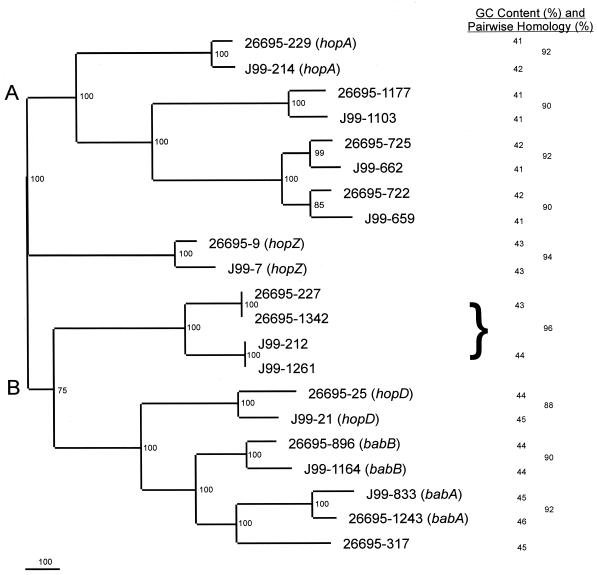
FIG. 1.
Nucleotide phylogram of babA paralogues from H. pylori strains 26695 and J99. Sequences were obtained from The Institute for Genomic Research database (26695) and the database at Astra-Boston (J99), aligned using GCG Pileup, and analyzed using PAUP 4.0b2 neighbor-joining analysis based on Kimura's two-parameter model distance matrices. Bootstrap values (based on 500 replicates) are represented at each node, and the branch length index is represented below the tree. Strain names and gene numbers are indicated at the termination of each branch. The percent nucleotide similarity (determined using GCG Gap) of each pair of homologs is indicated in the right column. The brace is used to indicate the similarity between the two sets of paired ORFs from each strain. The GC content of each ORF is shown in the middle column. The mean GC content of the paralogues of the top (A) cluster of (41.4 ± 0.6)% is significantly lower than that for the bottom (B) cluster ([44.2 ± 1.0]%; P < 0.001).

