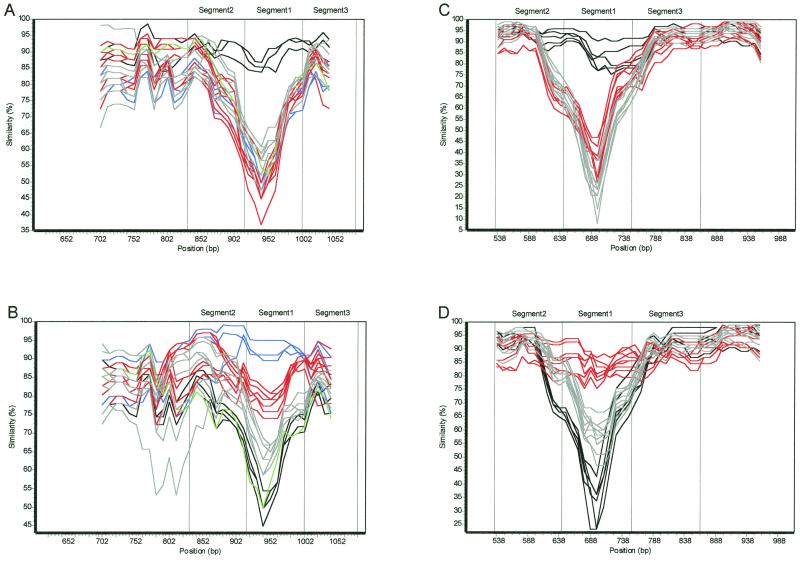
FIG. 3.
Similarity plots of babA and babB allele groups. Each plot was generated using 26 strains representing each of the babA and babB allele groups with a 100-bp window, a 10-bp step, and a Jukes-Cantor correction, using Simplot 2.5. Strains 96-71, 95-76, 98-292, 97-503, 97- 679, 97-723, 96-68, 98-12, 98-60, 96-68, 98-12, 98-60, 96-28, CCUG17875, 97-5, 97-687, 98-53, 98-344, 96-10, 95-10, 97-147, 98-18, 98-14, 98-24, 97-776, 98-10, 97-793, 84-183, and 26695 were used to represent the five different babA allele groups, and strains 95-10, 98-14, 98-10, 98-12, 98-24, 90-40, 98-292, 97-5, 84-183, 26695, CCUG17875, 97-503, 97-723, 98-18, 98-32, 98-22, 95-23, 97-776, 98-77, 98-16, 96-10, 98-30, 98-344, 98-454, and 98-60 were used to represent the three different babB allele groups. Allele groups AD1 and BD1 are depicted in black, groups AD2 and BD2 are depicted in gray, groups AD3 and BD3 are depicted in red, group AD4 is depicted in blue, and group AD5 is depicted in green. (A) Plot of babA sequences, using 96-71 (AD1) as the reference strain. (B) Plot of babA sequences, using 97-679 (AD4) as the reference strain. (C) Plot of babB sequences, using 95-10 (BD1) as the reference strain. (D) Plot of babB sequences, using 98-18 (BD3) as the reference strain.

