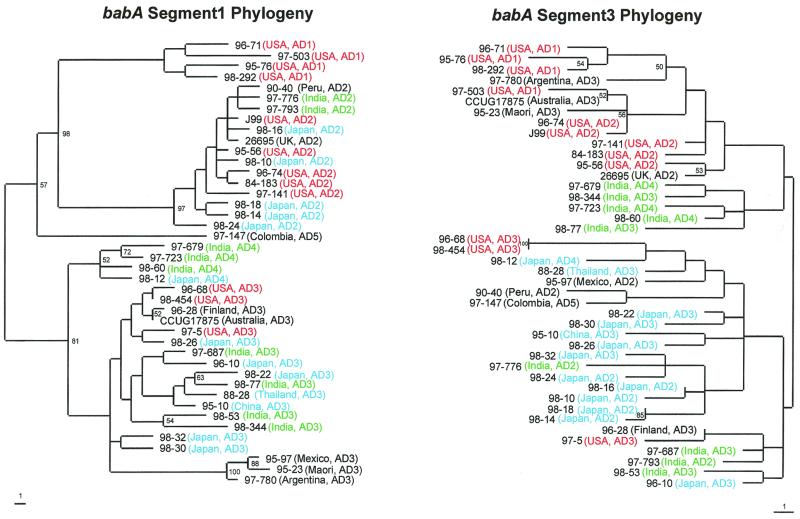
FIG. 4.
Phylograms of babA segment 1 (nucleotides 915 to 999 on the left) and babA segment 3 (nucleotides 1000 to 1084 on the right). Segment 1 includes the babA allele group-defining sequences, and segment 3 is the region downstream of segment 1. Regions from 42 strains underwent sequence analysis as previously described and were aligned using GCG Pileup, and specific regions were identified using GCG Pretty. The sequences then were realigned using ClustalW and subjected to phylogenetic analysis using Paup 4.0b2 neighbor-joining analysis based on Kimura's two-parameter model distance matrices. Strain number, geographic location, and allelic type (AD1 to AD5) are represented at the termination of each branch, and the branch length index is shown below each tree. Bootstrap values of >50 (based on 500 replicates) are shown at each node. Colors are used to represent strains from the United States (orange), Asia (other than India) (blue), India (green), and other countries or groups (black).

