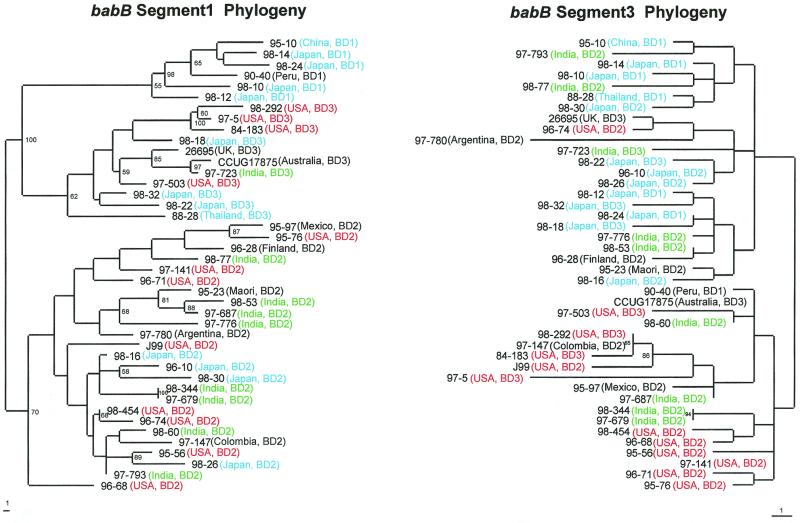
FIG. 6.
Phylograms of babB segment 1 (nucleotides 646 to 754 on the left) and babB segment 3 (nucleotides 755 to 863 on the right). Segment 3 is the region downstream of segment 1, which is the region from which the alleles of babB were described. Fragments from 42 strains underwent sequence analysis as previously described and were aligned using GCG Pileup, and specific regions were identified using GCG Pretty. The sequences were then realigned using ClustalW and subjected to phylogenetic analysis using Paup 4.0b2 neighbor-joining analysis based on Kimura's two-parameter model distance matrices. Strain numbers, geographic locations, and allelic types are represented at the termination of each branch, and the branch length index is shown below each tree. Bootstrap values of >50 (based on 500 replicates) are shown at each node. Colors are used to represent strains from the United States (orange), Asia (not including India) (blue), India (green), and other countries (black).

