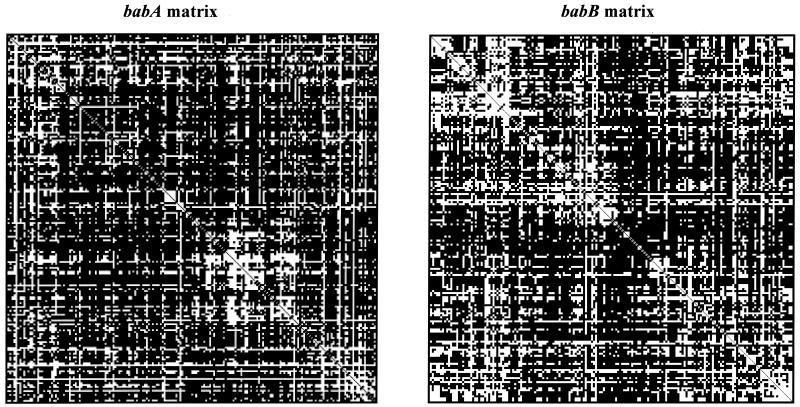
FIG. 7.
Compatibility analysis of the babA (left) and the babB (right) diversity regions from 42 H. pylori strains. In the matrix, compatible sites are represented by white boxes and incompatible sites are represented as black boxes. Series of incompatible sites probably arose from repeated recombination, whereas compatible sites arose under clonal descent. Matrices were created using Reticulate (26).

