FIGURE 2.

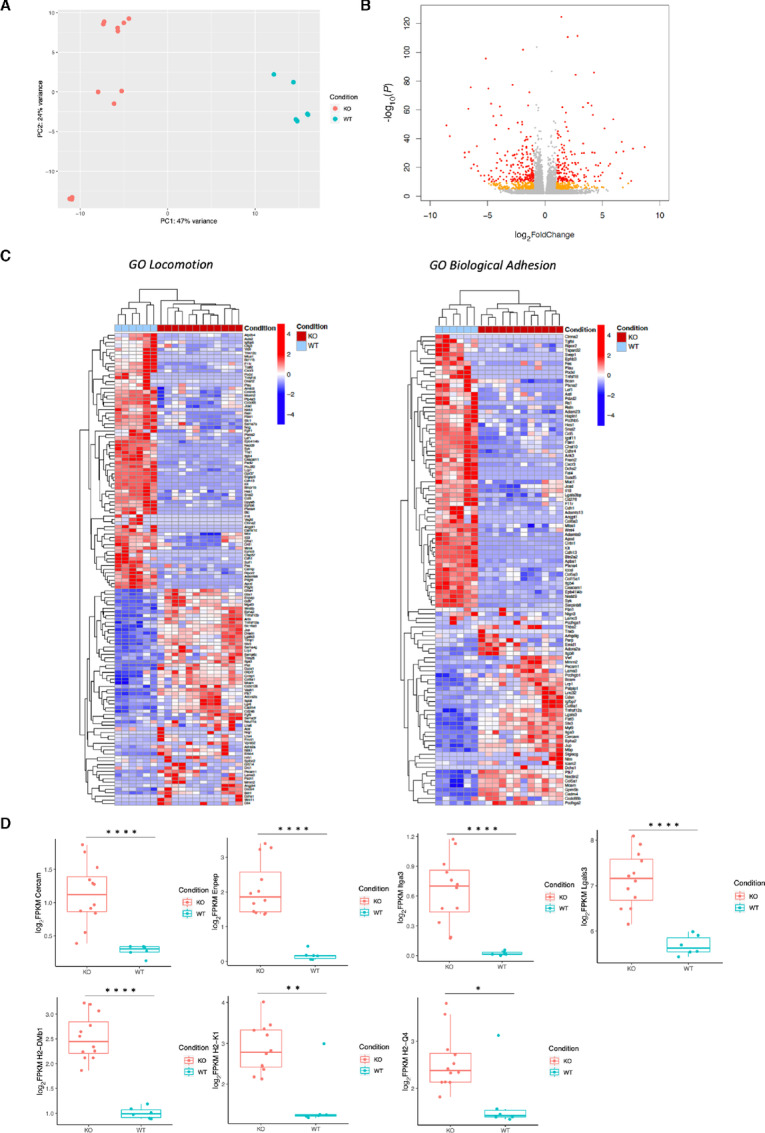
In vitro transcriptomic comparison of PAK4 KO and WT cells shows differences in extracellular matrix genes. A, PCA of 18 in vitro samples (12 B16 KO and 6 B16 WT CC). Principal component 1 (PC1) is related to PAK4 expression and explains almost half of the variance of this cohort (47%). B, Volcano plot derived from the differential gene expression analysis between B16 PAK4 KO and B16 WT CC samples. In red, genes with log2FC > 1 or < −1 and P < 5e-05. In orange, genes with log2FC > 1 or < −1 and P < 0.05. In gray, genes that do not fall in any of the two previous categories. C, Heatmap of two selected signatures: locomotion and biological adhesion from GO, after performing GSEA with the list of differentially expressed genes (q < 0.05 and log2FC >1 or <−1) resulted from B16 KO versus B16 WT CC comparison. Samples are separated on the basis of PAK4 expression (condition: B16 WT and B16 KO). Plotting the raw z-score. D, Differences between B16 PAK4 KO (n = 12) and B16 WT CC (n = 6) cells in the expression of genes associated to blood vessel formation: Cercam (P < 0.001), Enpep (P < 0.001), Itga3 (P < 0.001), Lgals3 (P < 0.001), and antigen presentation machinery: H2-Dmb1 (P < 0.001), H2-K1 (P = 0.003) and H2-Q4 (P = 0.03). Statistical significance for D was calculated using a two-tailed unpaired t test. ****, P < 0.0001; **, P < 0.01; *, P < 0.05.
