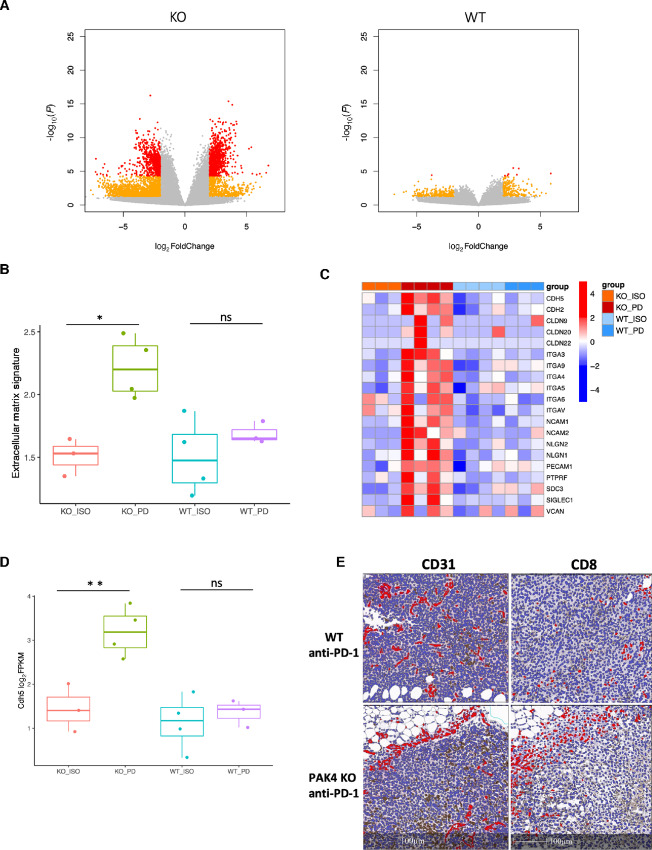
FIGURE 4.
Transcriptome analysis of PAK4 KO deletion resulting in tumor sensitization to anti-PD-1 treatment. A, Volcano plots derived from the differential gene expression analysis between untreated and anti-PD-1 treated B16 PAK4 KO tumors (left, n = 7) or B16 WT CC tumors (right, n = 7). In red, genes with log2FC > 1 or < −1 and P < 5e-05. In orange, genes with log2FC > 1 or < −1 and P < 0.05. In gray, genes that do not fall in any of the two previous categories. B, Comparison of the geometric mean of a signature related to the extracellular matrix (Reactome ECM) for each of the different four groups: B16 KO Isotype (KO ISO), B16 KO anti-PD-1 (KO PD), B16 WT Isotype (WT ISO), and B16 WT anti-PD-1 (WT PD). Only B16 PAK4 KO tumors significantly change upon anti-PD-1 treatment (P = 0.02). C, Heatmap of selected genes related to the ECM such as cadherins, claudins, and integrins among others. Again, anti-PD-1 treatment affects the expression of these genes only in B16 PAK4 KO tumors (P = 0.008). Plotting the raw z-score. D, Differences between B16 PAK4 WT and B16 KO anti-PD-1 treated tumors in the expression of genes specific for endothelial cells. E, Images from two representative B16 WT anti-PD-1 (top) and B16 PAK4 KO anti-PD-1 (bottom) tumors. Slides were stained with CD8 and CD31. Scale bar, 100 μm. Statistical significance for B and D was calculated using one-way ANOVA and correcting for multiple comparisons using statistical hypothesis testing with the Tukey test. **, P < 0.01; *, P < 0.05.

