FIGURE 7.
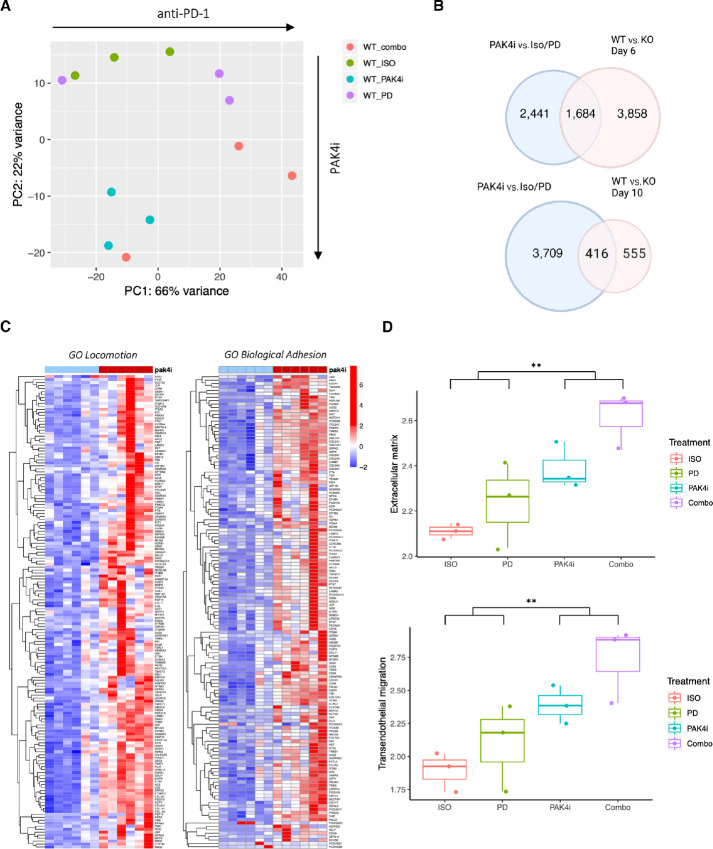
Transcriptome of tumors treated with PAK4 kinase inhibitor resemble the transcriptome of PAK4 KO cells. A, PCA of B16 WT tumors treated with PAK4 inhibitor (n = 3), isotype (n = 3), anti-PD-1 (n = 3) and combination of PAK4 inhibitor and anti-PD-1 (combo) (n = 3). Mice received six doses of PAK4 inhibitor and three of anti-PD-1 before harvesting tumors for RNA-seq. Principal component 1 (PC1) is related to anti-PD-1 effect and PC2 is related to the effect of PAK4 kinase inhibitor. B, Venn diagram showing the strong overlap between DEG (q < 0.05) PAK4i treated and in vivo samples. C, Heatmap (raw z-score) of two enriched GO signatures: locomotion and biological adhesion, after GSEA with the DEG from comparing PAK4i treated versus nontreated tumors. D, Comparison of the geometric mean of a signature related to the extracellular matrix (Reactome ECM, top, P = 0.0032 from comparing PAK4i treated vs. nontreated tumors) and a signature associated with transendothelial migration (bottom, P = 0.0068 from comparing PAK4i treated vs. nontreated tumors) for each of the different four groups: B16 WT Isotype (ISO), B16 WT anti-PD-1 (PD), B16 WT PAK4i (PAK4i), and B16 WT anti-PD-1 with PAK4i (Combo). Transendothelial migration signature consists of the following genes (Selp, Sele, Icam1, Vcam1, Icam2, Cd34, Fn1, F11r, Jam2, Jam3, Pecam1, Cd99, and Cdh5). PAK4 kinase inhibition, and especially when combined with anti-PD-1, increase the expression of both signatures. Statistical significance for D was calculated using a two-tailed unpaired t test. **, P < 0.01.

