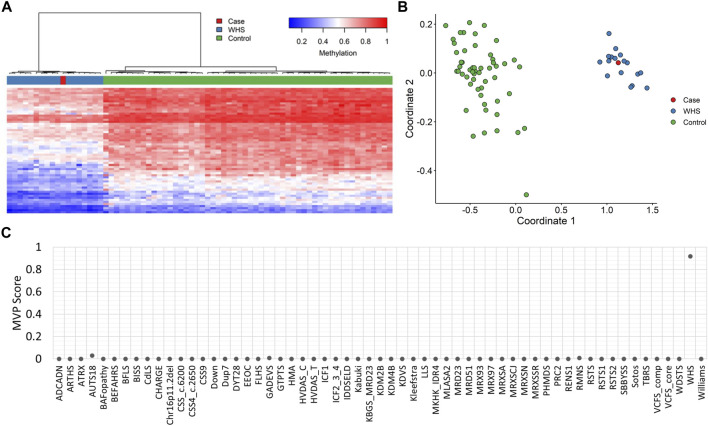
FIGURE 2.
EpiSignTM DNA methylation analysis of peripheral blood from a patient with a negative microarray (A) Hierarchical clustering and (B) multidimensional scaling plots indicate that the patient (purple) has a DNA methylation signature similar to subjects with a confirmed WHS episignature (red) and distinct from controls (green). Each row of the heatmap represents one CpG probe on the DNA methylation array, and each column represents one individual’s sample. The heatmap color scale from blue to red represents the DNA methylation level (beta value) from 0 (no methylation) to 1 (fully methylated). (C) MVP score, a multiclass supervised classification system capable of discerning between multiple episignatures by generating a probability score for each episignature. The elevated patient score for WHS compared to other syndromes suggests an episignature similar to the WHS reference signature.

