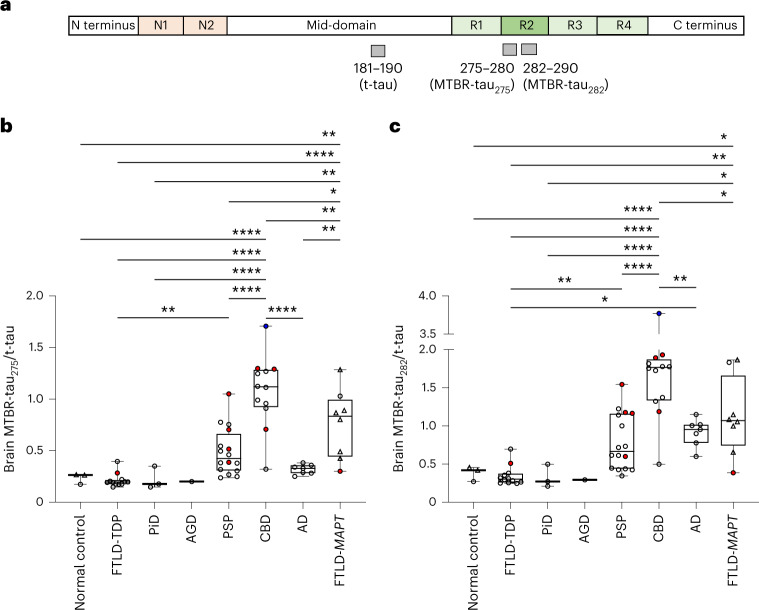
Fig. 1. 4R-specific insoluble brain MTBR-tau is enriched in CBD, FTLD-MAPT, AD and PSP.
a, Schematic of the quantified peptides of t-tau181–190 and 4R isoform-specific MTBR-tau in the R2 region (gray bars, MTBR-tau275 and MTBR-tau282). The relative abundance of each MTBR-tau was normalized to the t-tau peptide. b,c, MTBR-tau275/t-tau (b) and MTBR-tau282/t-tau (c) were measured in the tauopathy patient’s insoluble brain fractions from the SFG (circle, n = 54) and insula (triangle, n = 8). Both MTBR-tau species were most enriched in CBD (n = 12) and FTLD-MAPT (n = 8). PSP (n = 16) and AD (n = 7) had moderate enrichment. AGD (n = 1), PiD (n = 3) and FTLD-TDP (n = 12) did not change in MTBR-tau275 or MTBR-tau282 compared to normal control (n = 3). The red (n = 9) and blue (n = 1) filled circles indicate AD and PSP copathology, respectively. *P < 0.05, **P < 0.01, ****P < 0.0001. The box plots show the minimum, 25th percentile, median, 75th percentile and maximum. Differences in biomarker values were assessed with a one-way ANOVA. A two-sided P < 0.05 was considered statistically significant and corrected for multiple comparisons using a Benjamini–Hochberg FDR set at 5%.

