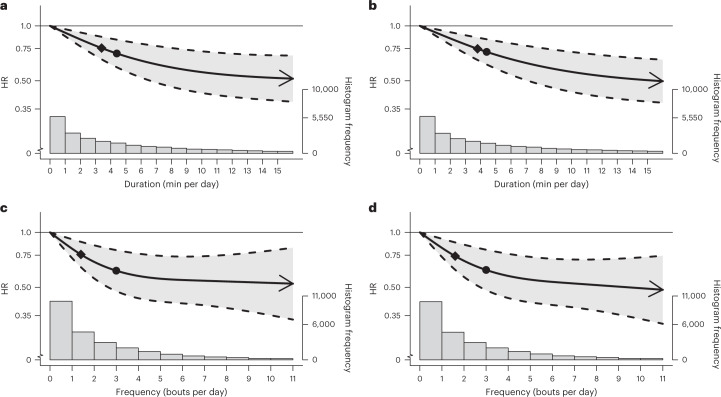
Fig. 4. Association of the daily duration and frequency of VILPA with cancer mortality.
a,b, Dose–response curves showing cancer mortality HRs associated with increasing daily duration of VILPA, for bouts of VILPA up to 1 min (a) and 2 min (b) in duration. c,d, Dose–response curves showing cancer mortality HRs associated with increasing daily frequency of VILPA, for length-standardized bouts of VILPA 1 min (c) and 2 min (d) in duration. Data are shown for n = 22,966 participants with 511 events and with a mean follow-up of 6.9 (0.8) years. Diamond, minimal dose, as indicated by the ED50 statistic which estimates the daily duration/frequency of VILPA associated with 50% of optimal risk reduction. Circle, HR associated with the median VILPA value (see Supplementary Table 4 for the list of values). Data are adjusted for the covariates listed in the online Methods. The shaded region demarcated by dashed lines represents the 95% CI. The solid line that lies within the shaded region represents the HR. The arrowhead represents the absence of an observed inflection point (for example, larger risk reduction with higher amounts of VILPA). The histogram on the right shows the sample distribution.

