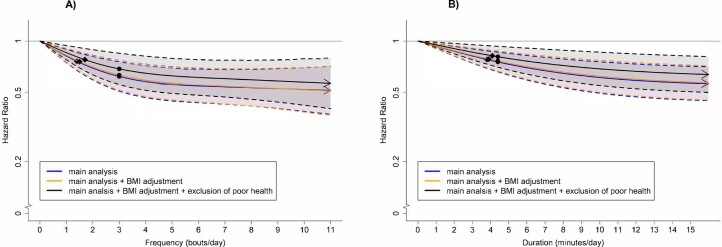
Extended Data Fig. 1. All-cause mortality dose-response of VILPA frequency and duration with adjustment for body mass index and exclusion of poor health.
Frequency of length-standardized VILPA bouts up to 2 minutes (A) and Duration of VILPA from bouts up to 2 minutes (B). Diamond: the minimal dose, as indicated by the ED50 statistic which estimates the daily duration/frequency of VILPA associated with 50% of optimal risk reduction. Circle: the hazard ratio associated with the median VILPA value. Analyses adjusted for age, sex, duration of light intensity physical activity, duration of moderate intensity physical activity, smoking history, alcohol consumption, accelerometer estimated sleep duration, fruit and vegetable consumption, education, self-reported parental history of cardiovascular disease and cancer, and self-reported medication use (cholesterol, blood pressure, and diabetes), and prevalent cancer and CVD. All analyses were additionally adjusted for vigorous physical activity bouts (VILPA frequency analyses) or vigorous physical activity duration (VILPA duration analyses) coming from bouts lasting more than two minutes. Models are sequentially adjusted for: (1) body mass index; (2) exclusion of participants who were underweight (<18.5 kg/m2 or self-reported poor health). See Online Methods for further details on the statistical methodology. Shaded region with dashed lines represents 95%CI. Solid line represents point estimate. Arrow represents no inflection point.

