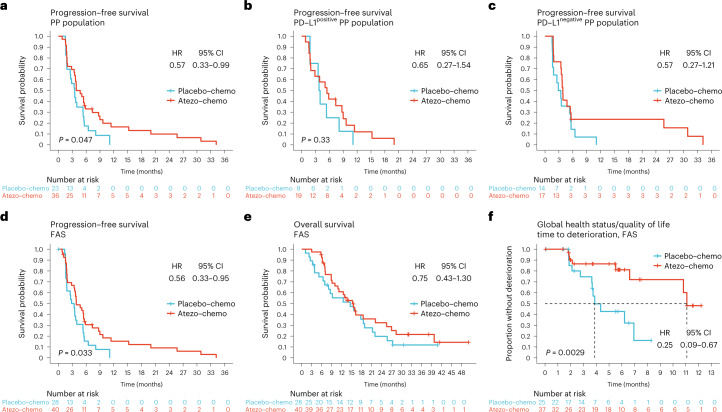
Fig. 2. Kaplan–Meier plots of survival outcomes and quality of life.
a–d, PFS assessed according to iRECIST in the PP population (a), the PD-L1positive (b) and PD-L1negative (c) PP population subsets and the FAS (d). e, OS in the FAS. f, Time to deterioration (reduction ≥20 points) of the global health status/quality of life score in the EORTC QLQ-C15-PAL questionnaire. The analysis includes the 62 patients (91%) in the FAS for whom a baseline value was available. The proportions of patients who completed this item at each of the subsequent timepoints are available in Extended Data Table 4. HRs with CIs were estimated using the Cox proportional hazards method. P values were calculated by the log-rank method.

