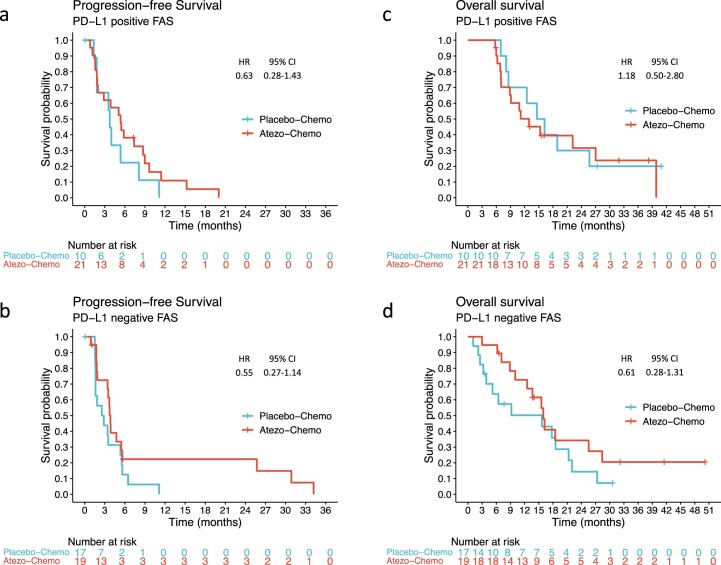
Extended Data Fig. 1. Kaplan-Meier plots of progression-free and overall survival by PD-L1 status (FAS).
Progression-free survival by iRECIST in the PD-L1 positive (a) and negative (b) subgroups of the full analysis set. Overall survival in the PD-L1 positive (c) and negative (d) full analysis set. Hazard ratios with confidence intervals were calculated using the Cox proportional hazards method. PD-L1, Programmed death-ligand 1; FAS, full analysis set; HR, hazard ratio; CI, confidence interval.

