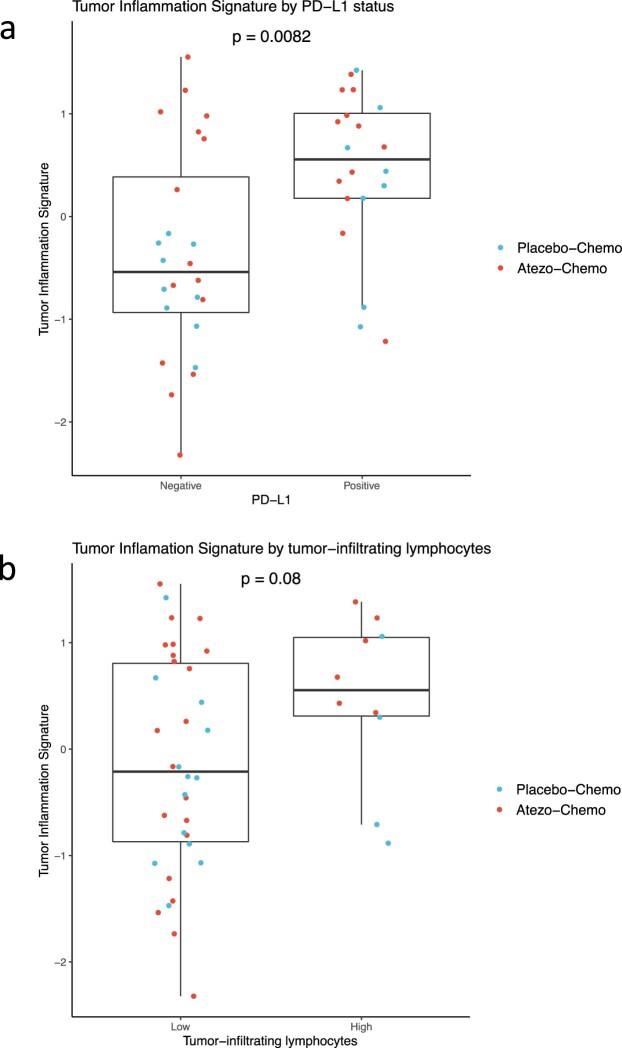
Extended Data Fig. 4. Correlation between Tumor Inflammation Signature and other biomarkers.
a: Tumor Inflammation Signature (TIS) in patients with PD-L1 negative and positive tumors. Both analyses were done on archival pre-study biopsies. For 28 of the 44 patients, the analyses were done in the same tumor sample, while 16 of the tumors analyzed for PD-L1 did not contain enough material to be analyzed for TIS. For these biopsies, the Nanostring assay was performed on a different archival biopsy. b: TIS in patients with low and high infiltration of lymphocytes in tumor. Tumor-infiltrating lymphocyte (TIL) abundance was assessed in study-specific pre-treatment biopsies, whereas TIS was analyzed in archival biopsies, due to the limited volume of the screening biopsies. Tumor Inflammation Signature was assessed by a single analysis of pre-treatment biopsies on the NanoString BC360 assay. All patients for whom a suitable archival biopsy was available were included in the analysis (n = 44). PD-L1 expression (SP142 ASSAY) and TIL were assessed once for each biopsy, by two experienced breast cancer pathologists that were blinded for treatment arm and clinical outcome. Two-sided p-values were calculated using the Wilcoxon rank sum test. In the box plots, the center line represents the median value and the box limits represent the upper and lower quartiles. The whiskers extends to the extreme values, omitting outliers extending > 1.5 x IQR from the box limits, these are shown in the dot plot. TIS, Tumor Inflammation Signature; PD-L1, programmed death-ligand 1; TIL, tumor-infiltrating lymphocytes.

