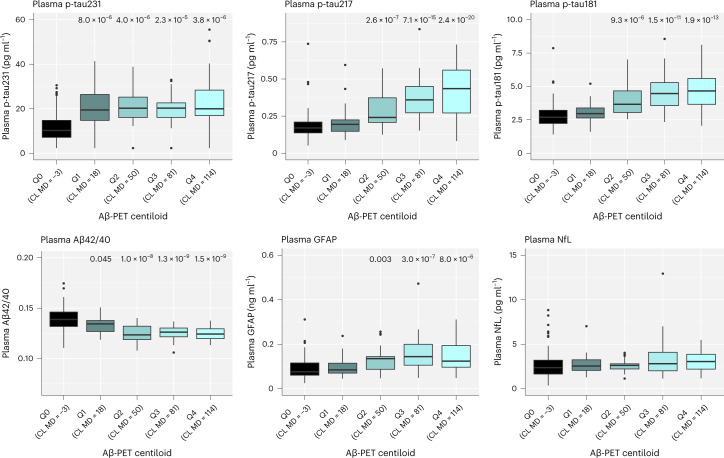
Fig. 1. Associations between plasma biomarkers and Aβ-PET in BioFINDER-1 (cohort 1).
Log10-transformed plasma biomarker levels were compared between the centiloid (CL) groups, <12 (MD −2.6; n = 139; reference group), Q1 (range 12.0–35.9; MD 17.9; n = 27), Q2 (range 35.9–71.7; MD 50.1; n = 24), Q3 (range 71.7–95.3; MD 80.6; n = 25) and Q4 (>95.3; MD 114.1; n = 25) using univariate general linear models adjusting for age. Untransformed data are presented in the boxplots to aid interpretation of biomarker values across different comparisons. One NfL outlier is not shown but was included in the statistical analysis. Boxes show interquartile range, the horizontal lines are medians and the whiskers were plotted using the Tukey method. Two-sided P values were corrected for multiple comparisons using Benjamini–Hochberg FDR; uncorrected and corrected P values are shown in Extended Data Table 6.

